Unlock a world of possibilities! Login now and discover the exclusive benefits awaiting you.
- Qlik Community
- :
- Forums
- :
- Analytics & AI
- :
- Products & Topics
- :
- Visualization and Usability
- :
- date range
- Subscribe to RSS Feed
- Mark Topic as New
- Mark Topic as Read
- Float this Topic for Current User
- Bookmark
- Subscribe
- Mute
- Printer Friendly Page
- Mark as New
- Bookmark
- Subscribe
- Mute
- Subscribe to RSS Feed
- Permalink
- Report Inappropriate Content
date range
Hi How to show the attached date range in Qliksense. please guide
Accepted Solutions
- Mark as New
- Bookmark
- Subscribe
- Mute
- Subscribe to RSS Feed
- Permalink
- Report Inappropriate Content
Hello,
Natively this use case scenario seems to be not supported. Natively you have only the following Date picker:
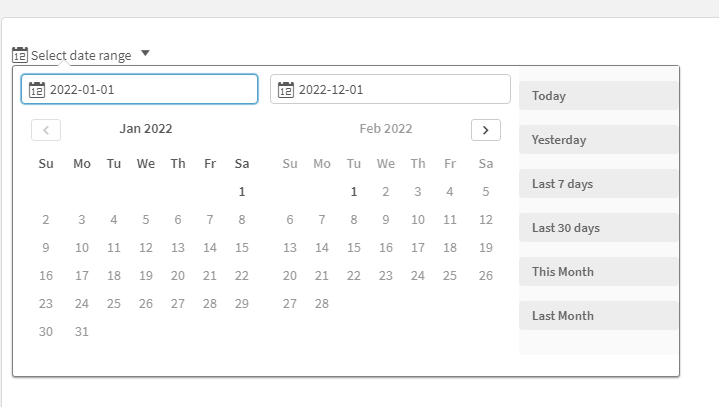
Your options for this use case scenario are:
- Submit a feature request [1]
- Check if any other developer has created any customer extension that is closer to your needs [2]
- Try to create your own customer extension [3] to achieve the desired use case scenario
I hope that this information was helpful. In case I have misunderstood the use case scenario, please elaborate in details by providing additional information. However, if it has helped you resolve the issue, addressed your concerns or at least pointed you in the right direction, please mark it as Accepted Solution to give further visibility to other community members.
---
[2] https://developer.qlik.com/garden
- Mark as New
- Bookmark
- Subscribe
- Mute
- Subscribe to RSS Feed
- Permalink
- Report Inappropriate Content
You take 'Filter pane' object from Charts selection and put in your sheet somewhere you need. Try to keep it 'horizontal', as I suggested, 1 grid tall (if needed you can change height of your grid a bit in sheet properties -> grid spacing)

Now you add you dimension you want to filter (in my case I convert date to month by month([DATE FIELD])):

and set Title similarly to:
=concat(distinct month([DATE FIELD]), ' | ', month([DATE FIELD]))
Final result will look like this:

- Mark as New
- Bookmark
- Subscribe
- Mute
- Subscribe to RSS Feed
- Permalink
- Report Inappropriate Content
Hello,
Natively this use case scenario seems to be not supported. Natively you have only the following Date picker:
Your options for this use case scenario are:
- Submit a feature request [1]
- Check if any other developer has created any customer extension that is closer to your needs [2]
- Try to create your own customer extension [3] to achieve the desired use case scenario
I hope that this information was helpful. In case I have misunderstood the use case scenario, please elaborate in details by providing additional information. However, if it has helped you resolve the issue, addressed your concerns or at least pointed you in the right direction, please mark it as Accepted Solution to give further visibility to other community members.
---
[2] https://developer.qlik.com/garden
- Mark as New
- Bookmark
- Subscribe
- Mute
- Subscribe to RSS Feed
- Permalink
- Report Inappropriate Content
A partial workaround is to set the filter to one grid high with a field month([YOUR DATE FIELD]) and set Title to:
=concat(distinct month([YOUR DATE FIELD]), ' | ', [YOUR DATE FIELD])
so it will look like yours button row.
Or try to search horizontal selection extension if you really need button-like selection, not filter popup.
- Mark as New
- Bookmark
- Subscribe
- Mute
- Subscribe to RSS Feed
- Permalink
- Report Inappropriate Content
Can you please clearly explain what kind of filter I need to set on grid. I have the month filed so did title set as per your comments.
- Mark as New
- Bookmark
- Subscribe
- Mute
- Subscribe to RSS Feed
- Permalink
- Report Inappropriate Content
You take 'Filter pane' object from Charts selection and put in your sheet somewhere you need. Try to keep it 'horizontal', as I suggested, 1 grid tall (if needed you can change height of your grid a bit in sheet properties -> grid spacing)
Now you add you dimension you want to filter (in my case I convert date to month by month([DATE FIELD])):
and set Title similarly to:
=concat(distinct month([DATE FIELD]), ' | ', month([DATE FIELD]))
Final result will look like this: