Unlock a world of possibilities! Login now and discover the exclusive benefits awaiting you.

- Qlik Community
- :
- Forums
- :
- Analytics & AI
- :
- Products & Topics
- :
- Visualization and Usability
- :
- handling null values in line chart
- Subscribe to RSS Feed
- Mark Topic as New
- Mark Topic as Read
- Float this Topic for Current User
- Bookmark
- Subscribe
- Mute
- Printer Friendly Page

 dreweezy
- Mark as New
- Bookmark
- Subscribe
- Mute
- Subscribe to RSS Feed
- Permalink
- Report Inappropriate Content
handling null values in line chart
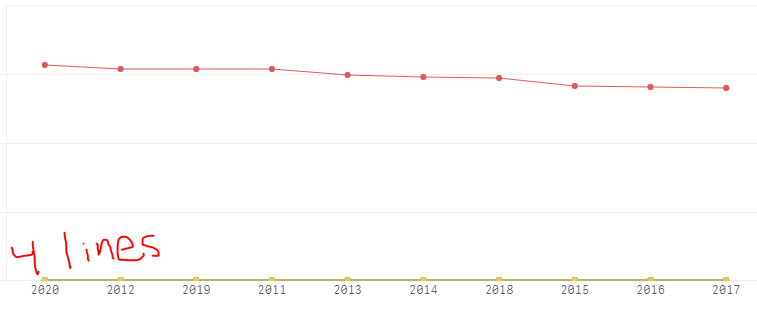
Hello, I have a line chart with multiple lines (these lines were manually created as our data is not pivoted to handle). Now, when a user goes and selects a value from a filter pane, it will show that specific line, but the other lines all drop to 0 on the x axis. I was hoping, upon selection of a value from the filter, it will only show 1 line but instead just drops the rest down to 0. Here is a snip of my problem.
How do I make it so upon selecting a filter value, the chart will only display that one line? I've tried excluding null values on the properties section and that doesn't do it.
Thanks.
- « Previous Replies
-
- 1
- 2
- Next Replies »

 Kashyap_R
- Mark as New
- Bookmark
- Subscribe
- Mute
- Subscribe to RSS Feed
- Permalink
- Report Inappropriate Content
Hi
Please find the solution in the attachment
Hope it helps
Thanks
Kashyap.R
 Stoyan_Terziev
- Mark as New
- Bookmark
- Subscribe
- Mute
- Subscribe to RSS Feed
- Permalink
- Report Inappropriate Content
Hey, I just tried it like this:
if(Sum({<[DEPT] *= {'IT'}>} REV)=0,Null(),Sum({<[DEPT] *= {'IT'}>} REV))and it seems to work just fine.
There could be something else in the chart you may need to check.
dreweezy
- Mark as New
- Bookmark
- Subscribe
- Mute
- Subscribe to RSS Feed
- Permalink
- Report Inappropriate Content
Thank you. I was able to implement this with my real data now. I was over complicating things on my end.

- « Previous Replies
-
- 1
- 2
- Next Replies »