Unlock a world of possibilities! Login now and discover the exclusive benefits awaiting you.
- Qlik Community
- :
- Forums
- :
- Analytics & AI
- :
- Products & Topics
- :
- Visualization and Usability
- :
- if logic help
- Subscribe to RSS Feed
- Mark Topic as New
- Mark Topic as Read
- Float this Topic for Current User
- Bookmark
- Subscribe
- Mute
- Printer Friendly Page
- Mark as New
- Bookmark
- Subscribe
- Mute
- Subscribe to RSS Feed
- Permalink
- Report Inappropriate Content
if logic help
Hi Experts,
Can any one please help me on below requirement.
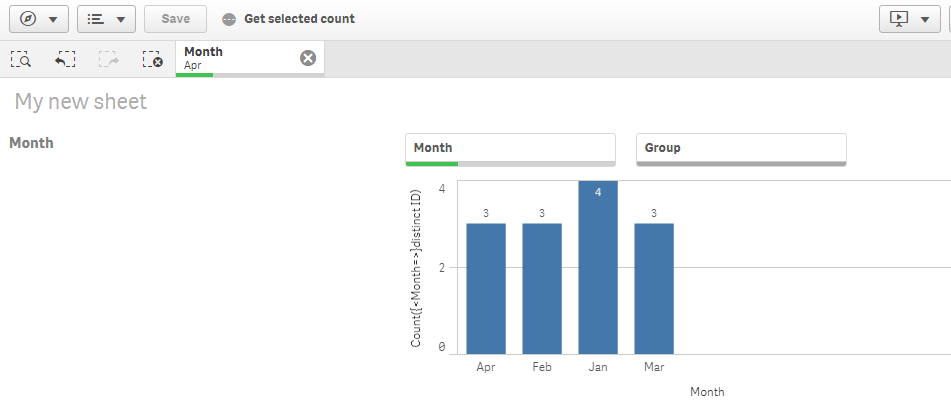
I have a bar chart with
Dimension = Month
Measure =Count({<Month=>}distinct ID)
Note :In My app I have used default selection extension for selecting max(Month) by default for other sheets charts purpose. In the below bar chart need to show all months so added Month= in above condition to avoid extension selections.
I have the below result with above dimension and measure
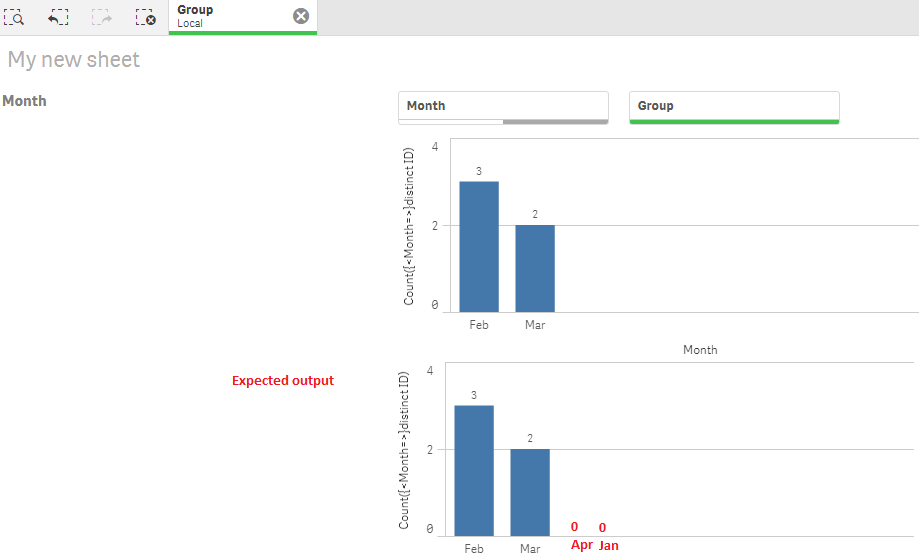
Requirement
Next I have filtered Group = LOCAL getting 3,2 for Feb and Mar months. Here for Jan and Apr there is no data. I have to show zero for Jan and Apr.
Please help me on this. Please find the below attached sample app. Here selections are applied on Month first then Group.
Thanks in advance.