Unlock a world of possibilities! Login now and discover the exclusive benefits awaiting you.

- Qlik Community
- :
- Forums
- :
- Analytics & AI
- :
- Products & Topics
- :
- Visualization and Usability
- :
- percentage stacked bar chart help
- Subscribe to RSS Feed
- Mark Topic as New
- Mark Topic as Read
- Float this Topic for Current User
- Bookmark
- Subscribe
- Mute
- Printer Friendly Page

- Mark as New
- Bookmark
- Subscribe
- Mute
- Subscribe to RSS Feed
- Permalink
- Report Inappropriate Content
percentage stacked bar chart help
I want to make a percentage stacked bar chart with sales data per territory per month but only for the last year. The last year of data was in 2014. This is where I am currently at.
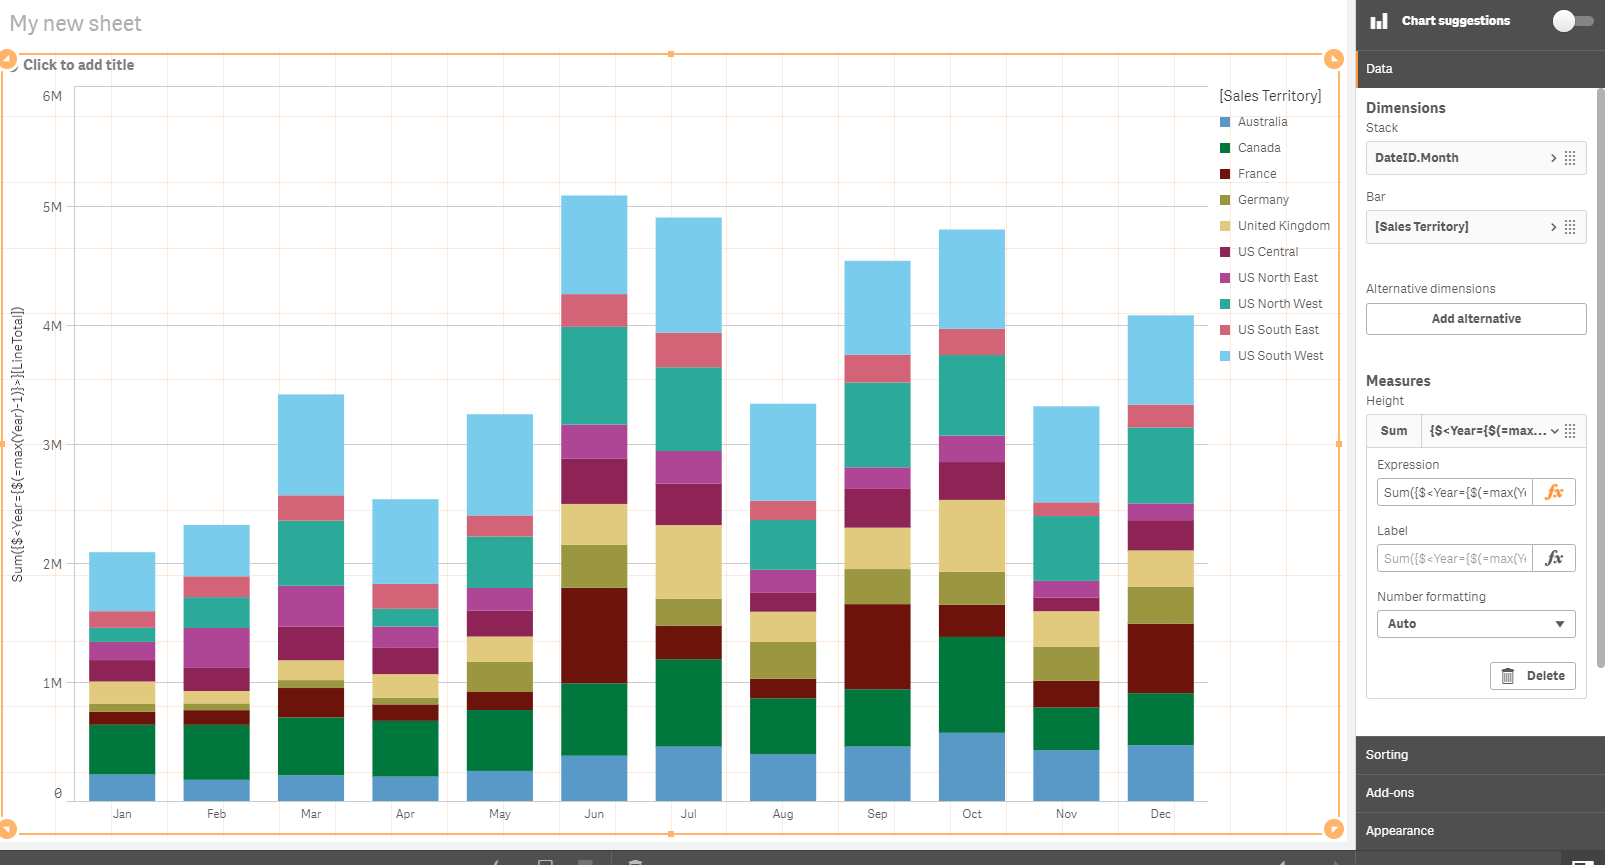
The expression I used in the measure was:
Sum({$<Year={$(=max(Year)-1)}>}[LineTotal])
Line total is the order total for a sale.
I need the current component contributed by each region to be expressed as a percentage of its total stack, with the restriction of data only from the most recent year of sales.
Accepted Solutions

 sunny_talwar
- Mark as New
- Bookmark
- Subscribe
- Mute
- Subscribe to RSS Feed
- Permalink
- Report Inappropriate Content
May be this
Sum({$<Year={$(=max(Year)-1)}>}[LineTotal])/Sum(TOTAL <DateID.Month> {$<Year={$(=max(Year)-1)}>}[LineTotal])
sunny_talwar
- Mark as New
- Bookmark
- Subscribe
- Mute
- Subscribe to RSS Feed
- Permalink
- Report Inappropriate Content
May be this
Sum({$<Year={$(=max(Year)-1)}>}[LineTotal])/Sum(TOTAL <DateID.Month> {$<Year={$(=max(Year)-1)}>}[LineTotal])
- Mark as New
- Bookmark
- Subscribe
- Mute
- Subscribe to RSS Feed
- Permalink
- Report Inappropriate Content
You are a legend. Thank you so much. It worked perfectly.