Unlock a world of possibilities! Login now and discover the exclusive benefits awaiting you.
- Qlik Community
- :
- Forums
- :
- Analytics & AI
- :
- Products & Topics
- :
- Visualization and Usability
- :
- scale uniformity in combo chart
- Subscribe to RSS Feed
- Mark Topic as New
- Mark Topic as Read
- Float this Topic for Current User
- Bookmark
- Subscribe
- Mute
- Printer Friendly Page
- Mark as New
- Bookmark
- Subscribe
- Mute
- Subscribe to RSS Feed
- Permalink
- Report Inappropriate Content
scale uniformity in combo chart
Hi,
i have taken dynamic scale using range max is it possible to maintain uniformity of scale. like step is 20 40 60.... or 10 20 30 .......
- Mark as New
- Bookmark
- Subscribe
- Mute
- Subscribe to RSS Feed
- Permalink
- Report Inappropriate Content
Hi @nvijay5757
The nature of Sense is that things will shift about, whether it be because of user selections or because of different users having different resolution monitors. It is therefore generally best to let Sense sort out the scale.
Because of this, there is no mechanism to force the step on chart axis.
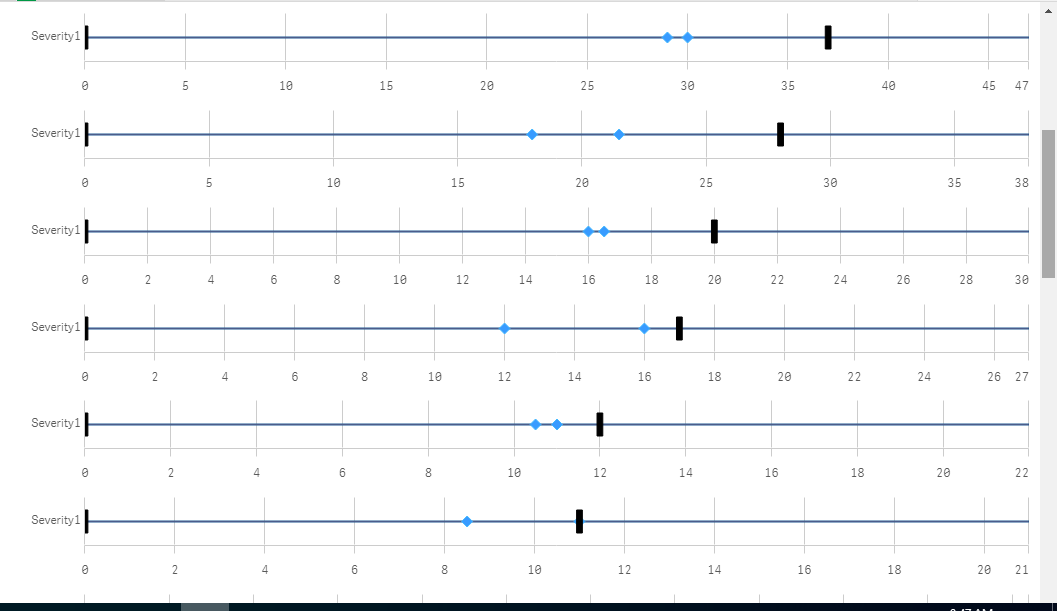
Another thing I have spotted is that on your charts although they are next to each other they are all on different scales. This could make them confusing. You might want to look at a trellis object to put each of the charts on the same scale - or set the max value yourself with something like:
=ceil(max(aggr(sum(Value), Severity)), 10)
Hope that helps,
Steve
- Mark as New
- Bookmark
- Subscribe
- Mute
- Subscribe to RSS Feed
- Permalink
- Report Inappropriate Content
Hi Steve, Thanks for your concern.
Measures: Pmin,Pmax,Tmin,Tmax all the values are max 250 only. then i have taken scale max 250. but in that scenario some symbols are not properly shown like Pmin-29,Pmax-30, T-min-0,T-max- 34. that one point difference not clearly shown. then i have used rangemax((pmax),(tmax)).
for this can you provide any suggestion.
in this no aggr. only min and max i have used in measures. min(Pmin) like.