Unlock a world of possibilities! Login now and discover the exclusive benefits awaiting you.

- Qlik Community
- :
- Forums
- :
- Analytics & AI
- :
- Products & Topics
- :
- Visualization and Usability
- :
- scatter chart
Options
- Subscribe to RSS Feed
- Mark Topic as New
- Mark Topic as Read
- Float this Topic for Current User
- Bookmark
- Subscribe
- Mute
- Printer Friendly Page
Turn on suggestions
Auto-suggest helps you quickly narrow down your search results by suggesting possible matches as you type.
Showing results for

 manoranjan_d
Specialist
2023-01-30
08:54 PM
- Mark as New
- Bookmark
- Subscribe
- Mute
- Subscribe to RSS Feed
- Permalink
- Report Inappropriate Content
scatter chart
Hi all,
I have requirement like this
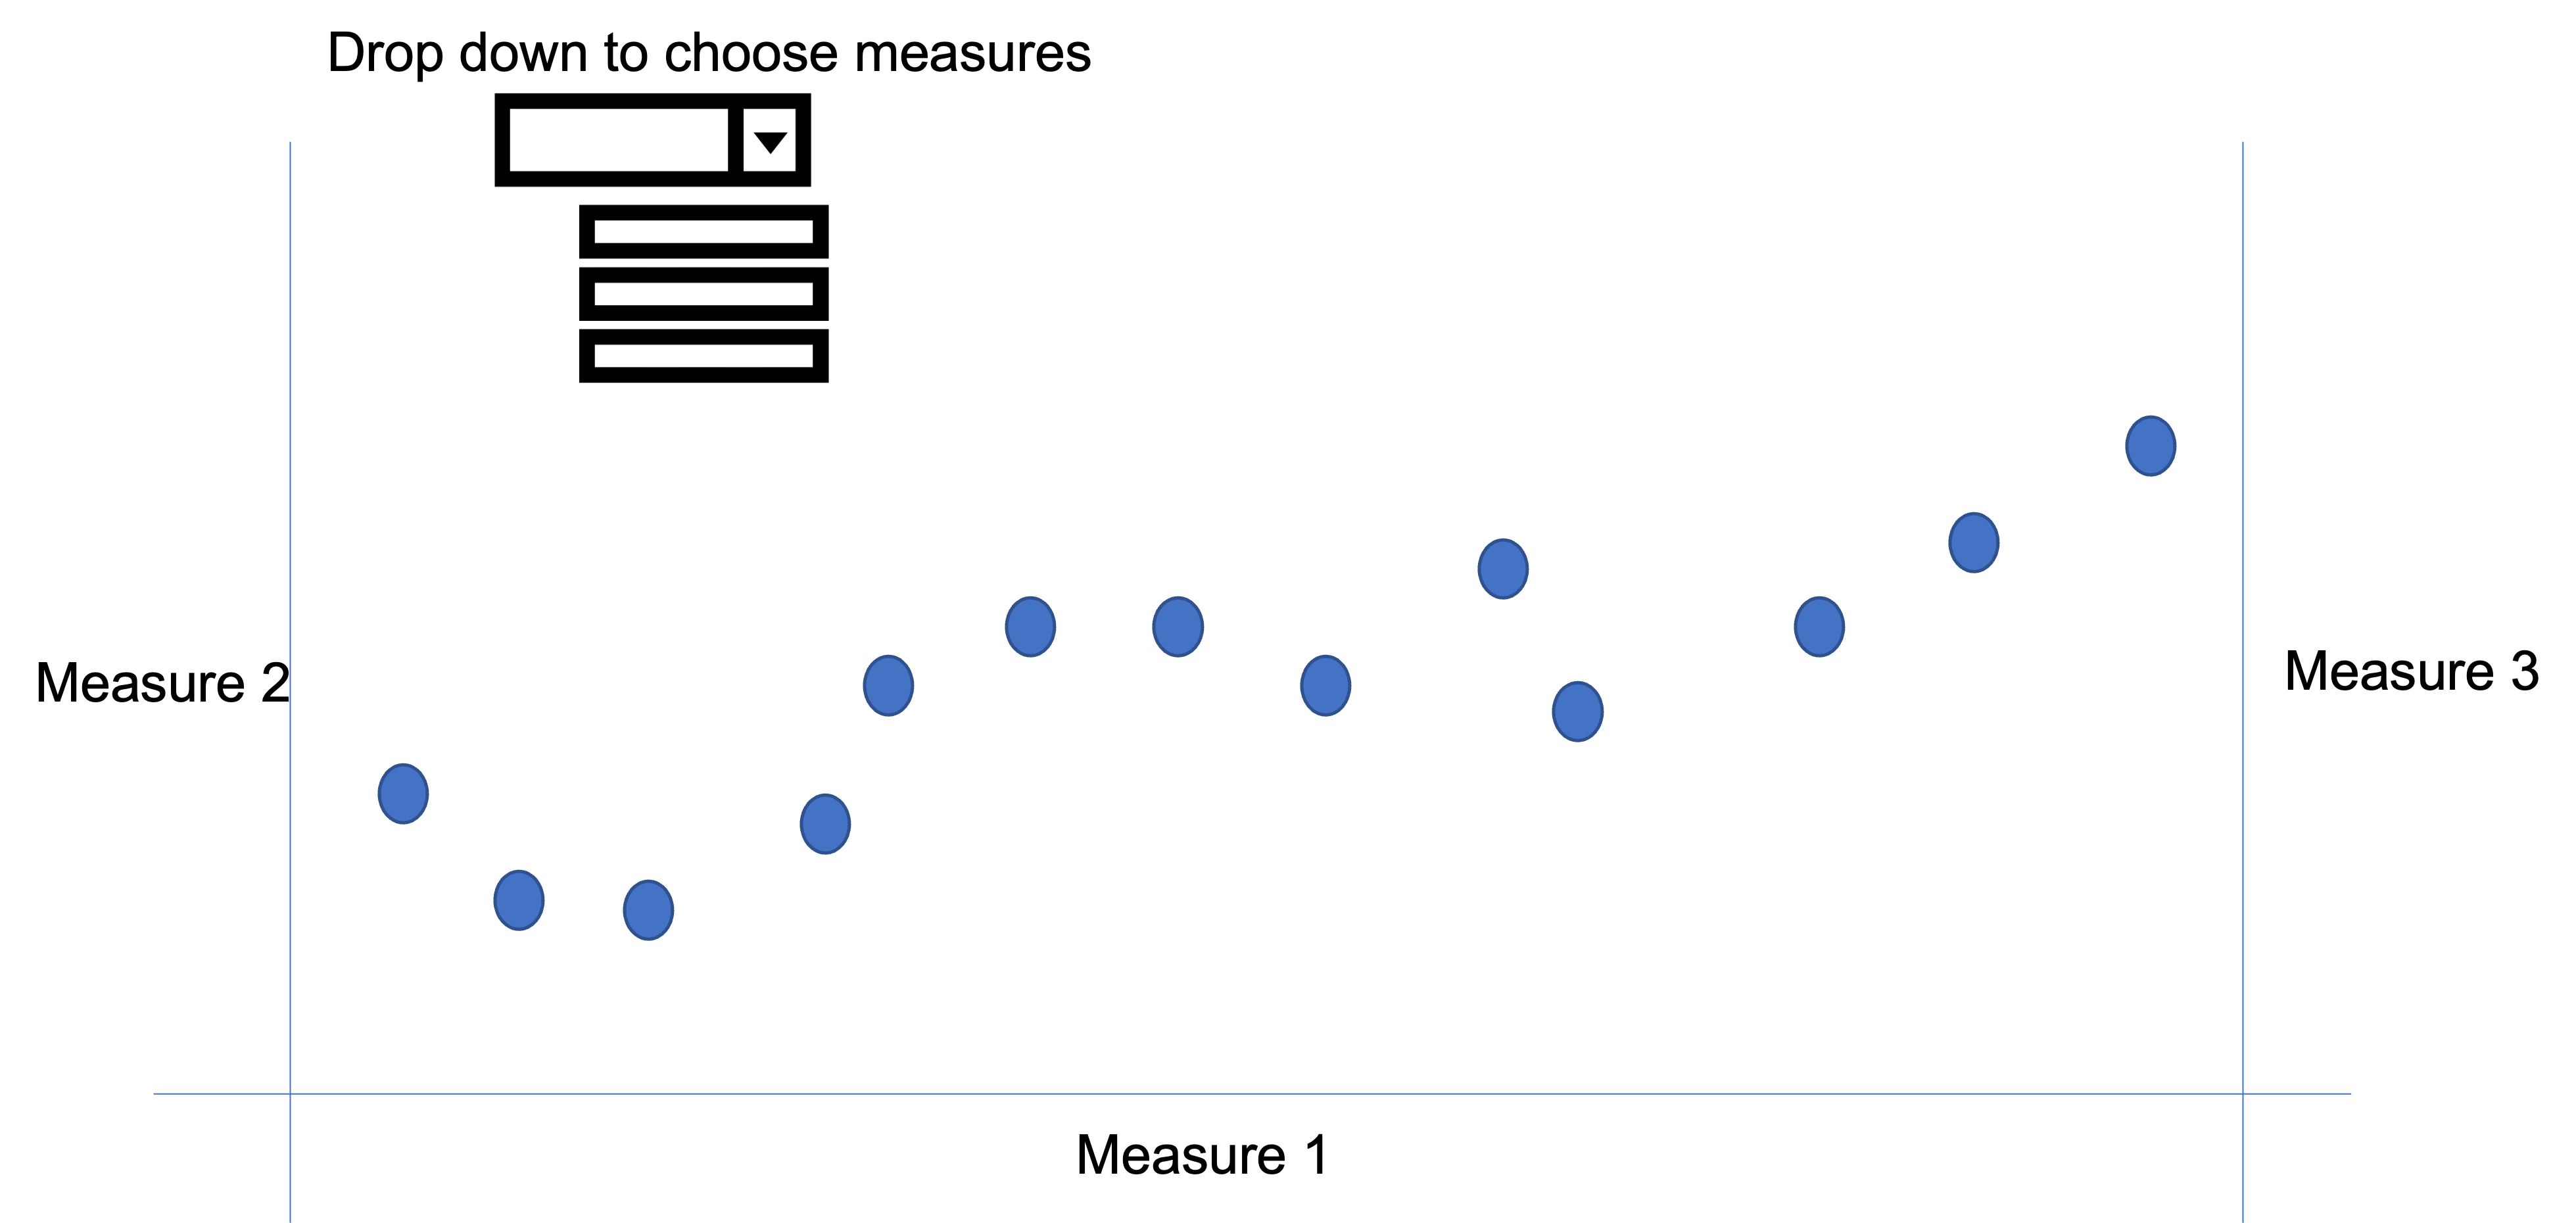
- Customer needs a scatter chart with 3 measures to be shown on the drop down on top.
- By selecting each measure, the other 2 related measures should also calculate accordingly and provide the scatter point.
PFA
1,127 Views
2 Replies
manoranjan_d
Specialist
2023-01-31
03:38 AM
Author
- Mark as New
- Bookmark
- Subscribe
- Mute
- Subscribe to RSS Feed
- Permalink
- Report Inappropriate Content
any experty to reply
1,083 Views

 ogster1974
Partner - Master II
2023-01-31
03:39 AM
- Mark as New
- Bookmark
- Subscribe
- Mute
- Subscribe to RSS Feed
- Permalink
- Report Inappropriate Content
The scatter plot wouldn't work as you mock up. Measure 1 and Measure 3 axis only work with 2 points being set for each dimension.
In Qlik the 3rd measure is used to control the size of the bubble not a axis in its own right.
In terms of the drop down you could have a data island with measure options that identify a measure and using a variable insert that into the setting measure logic. Or you could just use the built in alternate measure and explore functionality.

1,083 Views
