Unlock a world of possibilities! Login now and discover the exclusive benefits awaiting you.
- Qlik Community
- :
- Forums
- :
- Analytics & AI
- :
- Products & Topics
- :
- Visualization and Usability
- :
- Re: visualization in Qlik Sense
- Subscribe to RSS Feed
- Mark Topic as New
- Mark Topic as Read
- Float this Topic for Current User
- Bookmark
- Subscribe
- Mute
- Printer Friendly Page
- Mark as New
- Bookmark
- Subscribe
- Mute
- Subscribe to RSS Feed
- Permalink
- Report Inappropriate Content
visualization in Qlik Sense
Hi,
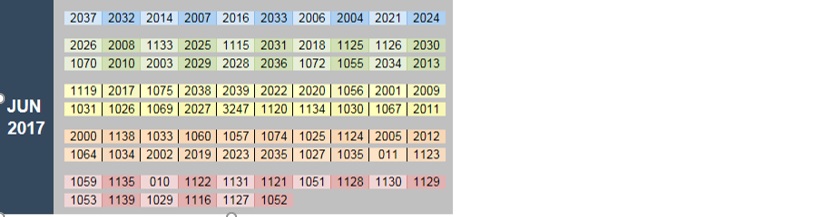
I have tried one requirement,but I dint able to finish it. I thought this will not be able to do in qlik sense. Please find the attachment of visualization. Can any one suggest, if you guys have any idea to implement in Qlik Sense?
- Mark as New
- Bookmark
- Subscribe
- Mute
- Subscribe to RSS Feed
- Permalink
- Report Inappropriate Content
HI Kumar,
You will have to create a widget / custom extension for this.
You need to go to DEV HUB and make an extension for this.
By default you cannot make this.
- Mark as New
- Bookmark
- Subscribe
- Mute
- Subscribe to RSS Feed
- Permalink
- Report Inappropriate Content
Hi Sumit,
Thanks for reply, here I should not use extensions.
- Mark as New
- Bookmark
- Subscribe
- Mute
- Subscribe to RSS Feed
- Permalink
- Report Inappropriate Content
Hi Lulu,
look at this: Qlik Branch
here you find a lot of solutions for your issue
I hope that helps
Beck
- Mark as New
- Bookmark
- Subscribe
- Mute
- Subscribe to RSS Feed
- Permalink
- Report Inappropriate Content
Is something like adding Column value in Pivot table of Qliksense (Along with row value & Measures).
- Mark as New
- Bookmark
- Subscribe
- Mute
- Subscribe to RSS Feed
- Permalink
- Report Inappropriate Content
Hi Bala,
yes, it is, or what do you expect to achieve? or how does look your expected output?
- Mark as New
- Bookmark
- Subscribe
- Mute
- Subscribe to RSS Feed
- Permalink
- Report Inappropriate Content
Hi Bala,
Its just Rank of one column based on the MonthYear, values should be in horizontal.
- Mark as New
- Bookmark
- Subscribe
- Mute
- Subscribe to RSS Feed
- Permalink
- Report Inappropriate Content
Hi Kumar,
Please mark the answer as answered or helpful as required.
Thanks and regards,
Sumit