Hi all,
I am struggling to add different measures into one Pivot table. Right now my pivot table looks like this:
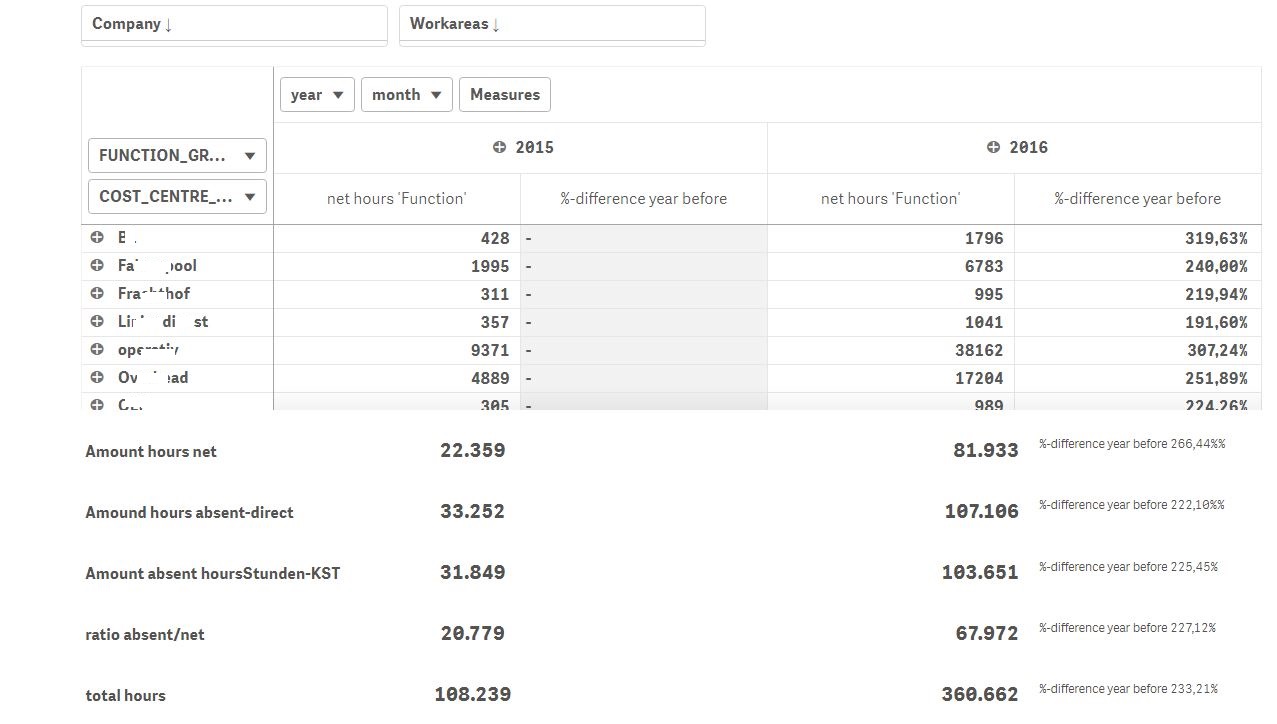
I have a pivot table which shows me the net hours each division has worked and the %-Difference to the year before.
Under the pivot table i have multiple KPIs. These show me the total amount of hours worked over all, absent hours. And the %-difference from 2016 to 2015 (comparing to the year before).
This doesn't look nice and I supposed to put this all into one table. My problem is if i add a new measure into the pivot table I get them as columns instead of a row below the actual pivot table.
Imagine that I want to enhance the pivot table multiple rows down and include the values that are below the pivot table into the pivot table.
I don't know if that is possible since there is text next to the KPIs. Is it possible to write text into the rows of a pivot table on the right of it the measure?
I thought about creating multiple pivot tables for each line of text and KPIs. But therefor I need to get rid of the headers. I know it's possible in QlikView but I read this function does not exist in QlikSense.
I think I have to make changes during the script. But I don't know what and how I should do that.
I have added a datasample.
Thank you for your help 