Unlock a world of possibilities! Login now and discover the exclusive benefits awaiting you.
- Qlik Community
- :
- All Forums
- :
- QlikView
- :
- pie-chart color change
- Subscribe to RSS Feed
- Mark Topic as New
- Mark Topic as Read
- Float this Topic for Current User
- Bookmark
- Subscribe
- Mute
- Printer Friendly Page
- Mark as New
- Bookmark
- Subscribe
- Mute
- Subscribe to RSS Feed
- Permalink
- Report Inappropriate Content
pie-chart color change
Hi All,
Can we change the color of Pie chart on the basis of their relative percentage like if a field has a highest percentage should have fix color and so on.
My case is dynamic and highest percentage owner changes on different selection
Thanks
Manish Madan
- Mark as New
- Bookmark
- Subscribe
- Mute
- Subscribe to RSS Feed
- Permalink
- Report Inappropriate Content
Try with colormix function:
ex.
=colormix1("field name has value between 0 and 1", RGB(90, 240, 96), RGB(227, 34, 6))
- Mark as New
- Bookmark
- Subscribe
- Mute
- Subscribe to RSS Feed
- Permalink
- Report Inappropriate Content
Hi Mario,
I tried but i could not do so.
could you please try to implement,please find the attached .qvw !
- Mark as New
- Bookmark
- Subscribe
- Mute
- Subscribe to RSS Feed
- Permalink
- Report Inappropriate Content
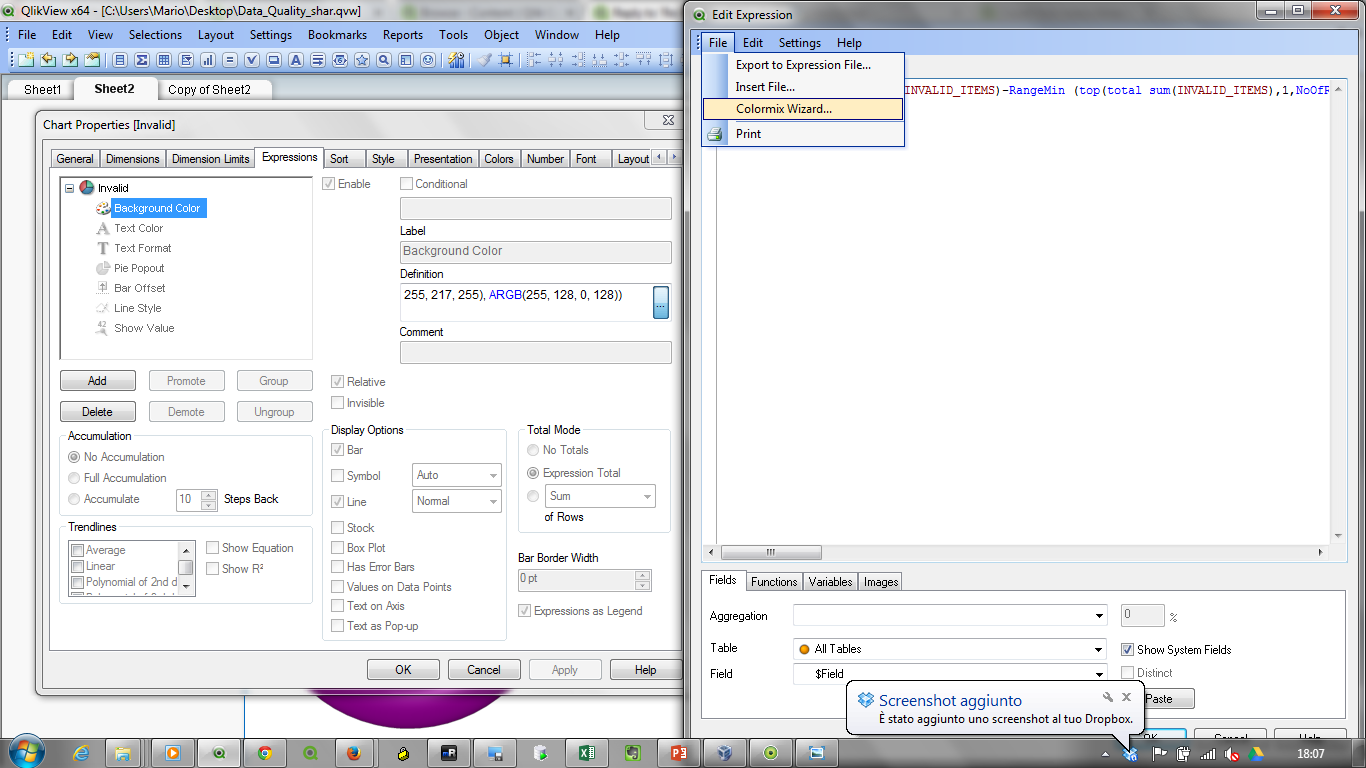
try with colormix wizard and see the attached qvw.
- Mark as New
- Bookmark
- Subscribe
- Mute
- Subscribe to RSS Feed
- Permalink
- Report Inappropriate Content
could you please share exact condition which you wrote in colormix wizard and give me a brief of it.
- Mark as New
- Bookmark
- Subscribe
- Mute
- Subscribe to RSS Feed
- Permalink
- Report Inappropriate Content
look this
- Mark as New
- Bookmark
- Subscribe
- Mute
- Subscribe to RSS Feed
- Permalink
- Report Inappropriate Content
Hi Mario,
I might be taking more time of yours,apologies .could you please the exact condition which you wrote in wizard because background color definition is not at all easy to understand and when i tried to back track the original condition is showing nothing and asking for new.
=colormix1("field name has value between 0 and 1(....?.....)", RGB(90, 240, 96), RGB(227, 34, 6)).
Thanks in advance
- Mark as New
- Bookmark
- Subscribe
- Mute
- Subscribe to RSS Feed
- Permalink
- Report Inappropriate Content
Hi, Manish
Look here:
Colormix1(Value , ColorZero , ColorOne)
This function returns an RGB color representation from a two color gradient, based on a value between 0 and 1.
If value = 0 the first color is returned.
If value = 1 the second color is returned.
If 0 < value < 1 the appropriate intermediate shading is returned.
Value is a real number between 0 and 1.
So if you have calculated field which values are between 0 and 1 just put it inside, if you don't just use smth like this
sum(smth) / sum( TOTAL smth) = value between 0 and 1
Hope this helps
Andrei