Unlock a world of possibilities! Login now and discover the exclusive benefits awaiting you.
- Qlik Community
- :
- All Forums
- :
- QlikView
- :
- restrict data in a table
- Subscribe to RSS Feed
- Mark Topic as New
- Mark Topic as Read
- Float this Topic for Current User
- Bookmark
- Subscribe
- Mute
- Printer Friendly Page
- Mark as New
- Bookmark
- Subscribe
- Mute
- Subscribe to RSS Feed
- Permalink
- Report Inappropriate Content
restrict data in a table
hello
i am a beginner with qlikview. i have a table in my data-warehouse in which i have negative and positive amounts in a columns
something like this:
| id | Type | amount sold |
|---|---|---|
| 1 | sales | 200 |
| 2 | return | -150 |
| 3 | sales | 200 |
i want just the positive amounts would be seen in just one of my pivot tables. so i dont want to use a list box and ask the end user to filter on Type=sales
is there any where in pivot table definition window to restrict data shown in it?
thank you
Mana
Accepted Solutions
- Mark as New
- Bookmark
- Subscribe
- Mute
- Subscribe to RSS Feed
- Permalink
- Report Inappropriate Content
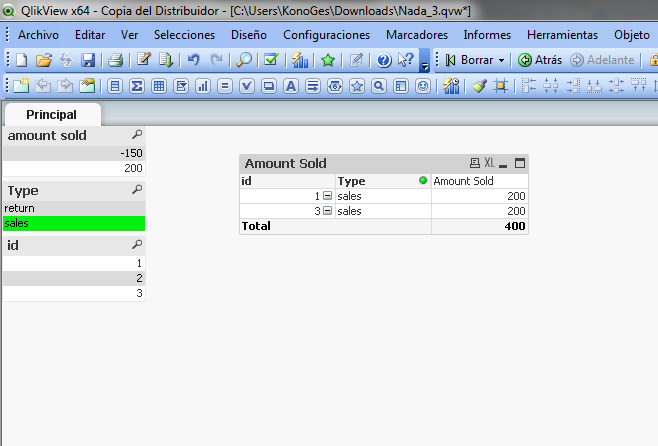
Hi Mana - let me know if this solves your issue -
QlikView has a very power expression syntax known as Set Analysis - it can doing many calculations with the in-memory data model - amazing things.
For your example - Set Analysis allows you to perform test conditions on your data to get exactly what you are looking for. So for example.
Sum(AmountSold) -- aggregates amount sold
Sum ({ <AmountSold ={">=0"}>}AmountSold)
States - aggregate amount sold where value of amountsold is greater than or equal to 0
You add this expression - to the expression box


I attached the QVW - but with the free personal edition you are limited to the number of QVWs you can open from others - (if you do not have a license)
Let me know
Mike
Mike Tarallo
Qlik
- Mark as New
- Bookmark
- Subscribe
- Mute
- Subscribe to RSS Feed
- Permalink
- Report Inappropriate Content
Hi Mana - This is the Sense forum - I will move your post over to the QlikView forum and also attempt to get you support for your issue.
Mike
Mike Tarallo
Qlik
- Mark as New
- Bookmark
- Subscribe
- Mute
- Subscribe to RSS Feed
- Permalink
- Report Inappropriate Content
if I have understood correctly, here's my proposed solution
- Mark as New
- Bookmark
- Subscribe
- Mute
- Subscribe to RSS Feed
- Permalink
- Report Inappropriate Content
Hi Mana - let me know if this solves your issue -
QlikView has a very power expression syntax known as Set Analysis - it can doing many calculations with the in-memory data model - amazing things.
For your example - Set Analysis allows you to perform test conditions on your data to get exactly what you are looking for. So for example.
Sum(AmountSold) -- aggregates amount sold
Sum ({ <AmountSold ={">=0"}>}AmountSold)
States - aggregate amount sold where value of amountsold is greater than or equal to 0
You add this expression - to the expression box
I attached the QVW - but with the free personal edition you are limited to the number of QVWs you can open from others - (if you do not have a license)
Let me know
Mike
Mike Tarallo
Qlik
- Mark as New
- Bookmark
- Subscribe
- Mute
- Subscribe to RSS Feed
- Permalink
- Report Inappropriate Content
i have got the point.
thank you friends.
Mana
- Mark as New
- Bookmark
- Subscribe
- Mute
- Subscribe to RSS Feed
- Permalink
- Report Inappropriate Content
Hi
In your chart properties under expressions tab, use the below
RangeMax(Sum([amount sold]),0)
or
Sum({$<Type={"=aggr(Sum([amount sold]), Type) > 0 "}>}[amount sold])