Unlock a world of possibilities! Login now and discover the exclusive benefits awaiting you.
- Qlik Community
- :
- All Forums
- :
- QlikView App Dev
- :
- difference highlight with any color?
- Subscribe to RSS Feed
- Mark Topic as New
- Mark Topic as Read
- Float this Topic for Current User
- Bookmark
- Subscribe
- Mute
- Printer Friendly Page
- Mark as New
- Bookmark
- Subscribe
- Mute
- Subscribe to RSS Feed
- Permalink
- Report Inappropriate Content
difference highlight with any color?
Hi experts ,
there is one req like
i am attaching excel file (sourcefile) and qvw
now my req is both sheets having same fields and data also 50% is matching
now my req is i want compare data between two sheets (row wise comparision) and and that difference data i want highlight in red color?
unmatched data between 2 sheets i want highlight with red color
PFA
- Tags:
- new_to_qlikview
- Mark as New
- Bookmark
- Subscribe
- Mute
- Subscribe to RSS Feed
- Permalink
- Report Inappropriate Content
Else,
You can try like below for said requirement,
PFA
- Mark as New
- Bookmark
- Subscribe
- Mute
- Subscribe to RSS Feed
- Permalink
- Report Inappropriate Content
Hi Thanks for the replu
it is not comparing row wise
Should be some other
- Mark as New
- Bookmark
- Subscribe
- Mute
- Subscribe to RSS Feed
- Permalink
- Report Inappropriate Content
Hi,
May be it will match with your requirement.
If no explain in little bit more..
- Mark as New
- Bookmark
- Subscribe
- Mute
- Subscribe to RSS Feed
- Permalink
- Report Inappropriate Content
First you want to load both tables, flagging which data has come from where;
Data:
LOAD
'T1' as Table,
AREA,
ID,
VALUE,
BUSINESS
FROM C:\Users\MANOJKUMAR\Desktop\DATA.xlsx
(ooxml, embedded labels, table is Sheet1);
Do the same for Table 2, with a CONCATENATE (rather than a NOCONCATENATE as you presently have).
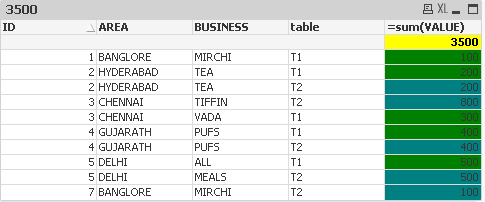
You can then create a table with VALUE and BUSINESS as Dimensions and expressions for T1 and T2 done with Set Analysis
sum({<Table={'T1'}>}VALUE)
and
sum({<Table={'T2'}>}VALUE)
You can then create a third column with the variance:
sum({<Table={'T2'}>}VALUE) / sum({<Table={'T1'}>}VALUE)
The colour you need to add to the Background Colour property of the third expression (by clicking on the plus symbol. The code will be something like:
=if(sum({<Table={'T1'}>}VALUE) <> sum({<Table={'T2'}>}VALUE)), rgb(255,100,100), null())
Hopefully that will give you what you need to make this work for you.
Steve