Unlock a world of possibilities! Login now and discover the exclusive benefits awaiting you.
- Qlik Community
- :
- All Forums
- :
- QlikView App Dev
- :
- Sum sales, group by date
- Subscribe to RSS Feed
- Mark Topic as New
- Mark Topic as Read
- Float this Topic for Current User
- Bookmark
- Subscribe
- Mute
- Printer Friendly Page
- Mark as New
- Bookmark
- Subscribe
- Mute
- Subscribe to RSS Feed
- Permalink
- Report Inappropriate Content
Sum sales, group by date
Hello Everyone,
So I have a chart with 2 dimensions, and a Date dimension running across the top. The sum of sales is my Expression. Unfortunately, what's happening in my chart is that every Territory is having every Date show up in the chart. The end result is that I have multiple dates when I only really need one. Also, I am restricting the dates to 7 days in the past. My calculated expression for my dates looks like so:
=if(Date >= today()-7 and Date < today(), Date)
And my busted chart looks like so:
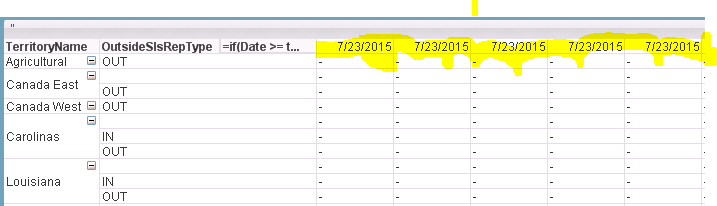
I've highlighted the Dates that I am being terrorized by.
Any help is greatly appreciated.
- Mark as New
- Bookmark
- Subscribe
- Mute
- Subscribe to RSS Feed
- Permalink
- Report Inappropriate Content
instead of doing that in the dimension do that in set analysis. It best practice. And how to do that is...create a variable
which says =today()-7
in your set analysis you can write ====
sum({<datefeild={'>=$(vPYseverdays)'}>} sales)
- Mark as New
- Bookmark
- Subscribe
- Mute
- Subscribe to RSS Feed
- Permalink
- Report Inappropriate Content
Make sure your Date field doesn't contain timestamp values. Merely displaying a timestamp value as a date doesn't make the time part go away. You can check for time fractions by adding a listbox with the Date field and setting the Number representation to for example Fixed with 2 or more decimals. You can use the floor() function in the script to cut of the time fractions of a date field: Floor(Date) as Date.
talk is cheap, supply exceeds demand