Unlock a world of possibilities! Login now and discover the exclusive benefits awaiting you.
- Qlik Community
- :
- All Forums
- :
- QlikView
- :
- Vertical Label
- Subscribe to RSS Feed
- Mark Topic as New
- Mark Topic as Read
- Float this Topic for Current User
- Bookmark
- Subscribe
- Mute
- Printer Friendly Page
- Mark as New
- Bookmark
- Subscribe
- Mute
- Subscribe to RSS Feed
- Permalink
- Report Inappropriate Content
Vertical Label
Hi,
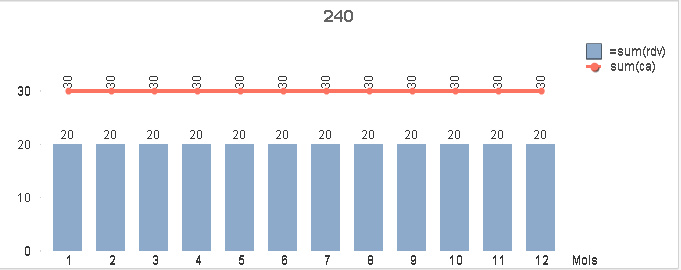
I would like the label of the bar chart verticaly but horizontaly for the curve.
Someone has an idea ?
Thanks.
- Tags:
- new_to_qlikview
- « Previous Replies
-
- 1
- 2
- Next Replies »
Accepted Solutions
- Mark as New
- Bookmark
- Subscribe
- Mute
- Subscribe to RSS Feed
- Permalink
- Report Inappropriate Content
- Mark as New
- Bookmark
- Subscribe
- Mute
- Subscribe to RSS Feed
- Permalink
- Report Inappropriate Content
Can you explain what you consider to be the labels of the bar and the line chart?
talk is cheap, supply exceeds demand
- Mark as New
- Bookmark
- Subscribe
- Mute
- Subscribe to RSS Feed
- Permalink
- Report Inappropriate Content
Hi Gysbert (maxime66 speaking with other profile)
My explanation was not very clear, an example of what i expect is better (Excel file attached).
- Mark as New
- Bookmark
- Subscribe
- Mute
- Subscribe to RSS Feed
- Permalink
- Report Inappropriate Content
Afaik what you want is not possible. And from a ux and data visualization point of view that is actually a good thing in this case. So, if you want to create that kind of dysfunctional chart you'll have to find some other tool 
talk is cheap, supply exceeds demand
- Mark as New
- Bookmark
- Subscribe
- Mute
- Subscribe to RSS Feed
- Permalink
- Report Inappropriate Content
Thanks anyway !
But i don't see the "Dysfunctional" in that  , it's a kind of very basic option in many softwares that is missing in Qlik solution.
regards.
- Mark as New
- Bookmark
- Subscribe
- Mute
- Subscribe to RSS Feed
- Permalink
- Report Inappropriate Content
Yes, most BI software is capable of creating, and indeed promotes the creation of, completely dysfunctional information displays.
talk is cheap, supply exceeds demand
- Mark as New
- Bookmark
- Subscribe
- Mute
- Subscribe to RSS Feed
- Permalink
- Report Inappropriate Content
Seems you have a lot of Qlikview's stock options
I love the Qlik solutions (4 years using it) , but sometimes (like other softs) it has some incredibly deficiencies:
One of them : no native way too display values inside Pie charts !!!!!
For me this is a real "dysfunction"
regards
- Mark as New
- Bookmark
- Subscribe
- Mute
- Subscribe to RSS Feed
- Permalink
- Report Inappropriate Content
You might consider using Qliksense instead and get a new extensions from qlik branch
This is a freeware Jave applets developed to enrich qliksense with new charts and graphs that are limited in qlikview
http://branch.qlik.com/projects/forumdisplay.php?6-Projects&sort=dateline&order=desc
Thanks
- Mark as New
- Bookmark
- Subscribe
- Mute
- Subscribe to RSS Feed
- Permalink
- Report Inappropriate Content
I could tell you what I think of your requirement, but that has been written down by one of the foremost experts in the field already: http://www.perceptualedge.com/articles/visual_business_intelligence/save_the_pies_for_dessert.pdf
This quote from the top of page 4 sums it up:
"We turned the pie chart into an awkwardly arranged equivalent of a table of labels and values."
talk is cheap, supply exceeds demand
- Mark as New
- Bookmark
- Subscribe
- Mute
- Subscribe to RSS Feed
- Permalink
- Report Inappropriate Content
Like this ?
see the attached
- « Previous Replies
-
- 1
- 2
- Next Replies »