Unlock a world of possibilities! Login now and discover the exclusive benefits awaiting you.
- Qlik Community
- :
- All Forums
- :
- QlikView
- :
- Hide and Show $0 using Selection in List Box
- Subscribe to RSS Feed
- Mark Topic as New
- Mark Topic as Read
- Float this Topic for Current User
- Bookmark
- Subscribe
- Mute
- Printer Friendly Page
- Mark as New
- Bookmark
- Subscribe
- Mute
- Subscribe to RSS Feed
- Permalink
- Report Inappropriate Content
Hide and Show $0 using Selection in List Box
Hi All,
I have a chart like this below -
| Account | Invoices | Qty | Purchases |
| AA1 | 100 | 20 | $100 |
| AA1 | 101 | 40 | $0 |
| AA1 | 102 | 10 | $20 |
| AA2 | 200 | 50 | $80 |
| AA2 | 200 | 35 | $60 |
| AA2 | 200 | 25 | $0 |
| AA2 | 200 | 45 | $0 |
Requirement -
I need to create a List Box called - 'Hide $0 Invoices' and having two values - Exclude and Include.
When Exclude will be selected - the rows having Purchases as $0, will be hidden.
When Include will be selected - the rows having Purchases as $0, will be visible.
By default the selection should be at Exclude.
Please help!
- « Previous Replies
-
- 1
- 2
- Next Replies »
Accepted Solutions
- Mark as New
- Bookmark
- Subscribe
- Mute
- Subscribe to RSS Feed
- Permalink
- Report Inappropriate Content
You can simply tweak the data model and add the flag table to data model. Then you don't need any complex expressions on UI.
Data:
LOAD
*,
If(Purchase=0,0,1) AS _Flag
;
LOAD * Inline [
Account,Invoice,Qty,Purchase
AA1,100,20,100
AA1,101,40,0
AA1,102,10,20
AA2,200,50,80
AA2,201,35,60
AA2,202,25,0
AA2,203,45,0
];
_FlagTable:
LOAD * Inline [
_Flag , SelectName
1, Include 0
0, Include 0
1, Exclude 0
];
Create the Straight table with 3 dims & 1 expression.
Please find the attached sample qvw.
- Mark as New
- Bookmark
- Subscribe
- Mute
- Subscribe to RSS Feed
- Permalink
- Report Inappropriate Content
Try the attached application
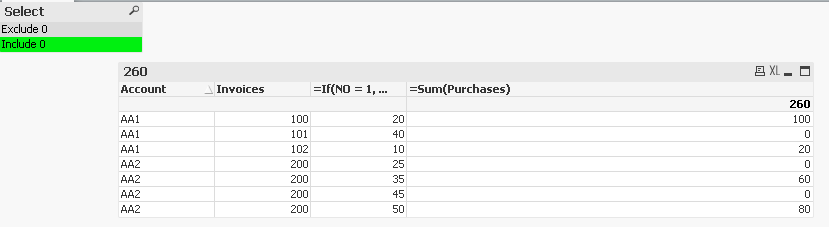
Include 0s
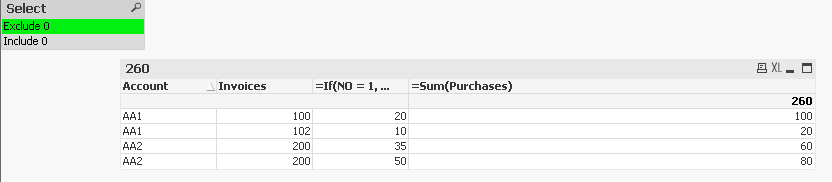
Exclude 0s
Script:
Table:
LOAD Account,
Invoices,
Qty,
Money#(Purchases, '$###') as Purchases
FROM
[https://community.qlik.com/thread/203929]
(html, codepage is 1252, embedded labels, table is @1);
ListBox:
LOAD * Inline [
Select, NO
Exclude 0, 0
Include 0, 1
];
Straight Table:
Dimension
1) Account
2) Invoices
3) =If(NO = 1, Qty, If(Aggr(Sum(Purchases), Qty) > 0, Qty)) (With 'Suppress When Value Is Null' selected on dimension tab)
Expression
=Sum(Purchases)
Presentation tab
Uncheck 'Supress Zero-Values'
- Mark as New
- Bookmark
- Subscribe
- Mute
- Subscribe to RSS Feed
- Permalink
- Report Inappropriate Content
Add script level flag or try below expression
Sum({<Purchase_Amount={"Purchase_Amount>0"}>} Purchase_Amount)
- Mark as New
- Bookmark
- Subscribe
- Mute
- Subscribe to RSS Feed
- Permalink
- Report Inappropriate Content
Hey sunindia,
Thank you for quick help. It is really good.
Can I have the Qty as it is in the Expression Tab and put some conditions for Invoice field atleast?
Wanted to Hide the Invoice for which Purchase = $0
My Bad- I hadn't changed the Invoice Value for the second Account AA2. Just updated the table -
| Account | Invoices | Qty | Purchases |
| AA1 | 100 | 20 | $100 |
| AA1 | 101 | 40 | $0 |
| AA1 | 102 | 10 | $20 |
| AA2 | 200 | 50 | $80 |
| AA2 | 201 | 35 | $60 |
| AA2 | 202 | 25 | $0 |
| AA2 | 203 | 45 | $0 |
- Mark as New
- Bookmark
- Subscribe
- Mute
- Subscribe to RSS Feed
- Permalink
- Report Inappropriate Content
See if this is what you want
- Mark as New
- Bookmark
- Subscribe
- Mute
- Subscribe to RSS Feed
- Permalink
- Report Inappropriate Content
Updated app with updated sample
- Mark as New
- Bookmark
- Subscribe
- Mute
- Subscribe to RSS Feed
- Permalink
- Report Inappropriate Content
Awesome 
- Mark as New
- Bookmark
- Subscribe
- Mute
- Subscribe to RSS Feed
- Permalink
- Report Inappropriate Content
Oh Great sunindia,
This is what I wanted. Thanks a lot for this help. Got a concept! Kudos to you.
- Mark as New
- Bookmark
- Subscribe
- Mute
- Subscribe to RSS Feed
- Permalink
- Report Inappropriate Content
Hi sunindia
By any means the If condition taken into script level?
Including it at the chart level, shows a performance issue when the chart has lot more dimensions and data.
- Mark as New
- Bookmark
- Subscribe
- Mute
- Subscribe to RSS Feed
- Permalink
- Report Inappropriate Content
Calculated dimensions are usually resource intensify. We can look at a expression based solution?
- « Previous Replies
-
- 1
- 2
- Next Replies »