Unlock a world of possibilities! Login now and discover the exclusive benefits awaiting you.
- Qlik Community
- :
- Forums
- :
- Analytics & AI
- :
- Products & Topics
- :
- Visualization and Usability
- :
- Accumulate amount by month per day
- Subscribe to RSS Feed
- Mark Topic as New
- Mark Topic as Read
- Float this Topic for Current User
- Bookmark
- Subscribe
- Mute
- Printer Friendly Page
- Mark as New
- Bookmark
- Subscribe
- Mute
- Subscribe to RSS Feed
- Permalink
- Report Inappropriate Content
Accumulate amount by month per day
Hello Community,
First time here...
Please be so kind as to point me in the right direction with regards to the following:
We have just installed Qlik Sense on our servers. (going for 2nd week)
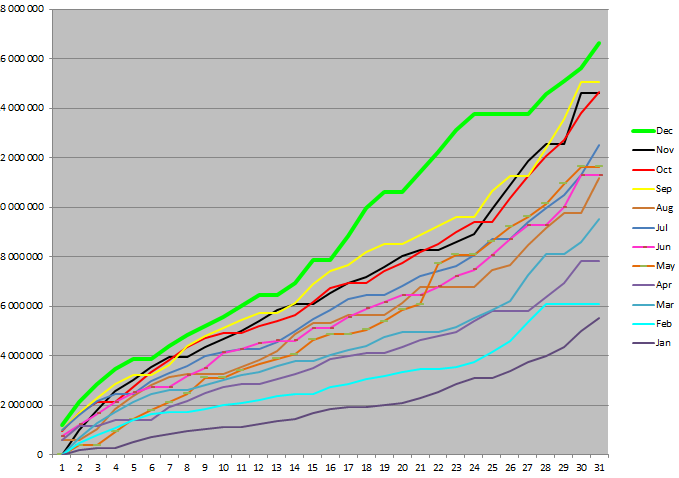
I am trying to display a chart in Qlik Sense so that it displays the same or similar way that it is currently displaying on my excel spreadsheet below: (Accumulated amount per month per day)
I have tried the below suggestions found on several forums, but none of these worked.
// rangesum( above( sum(AmtCollected),0,RowNo()))
// rangesum( above( sum(AmtCollected),0,RowNo()))
// sum( aggr( rangesum( above( sum(AmtCollected),0,12) ),Month))
// RangeSum(Above(Total sum(AmtCollected),0,RowNo()))
// sum(AmtCollected)
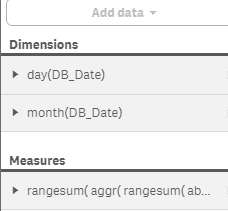
The fields that I am currently using are as follow:
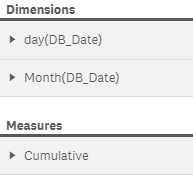
Any idea on what I am doing wrong?
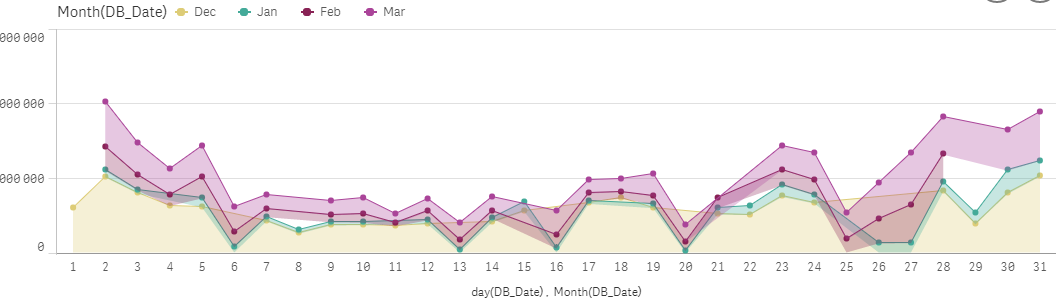
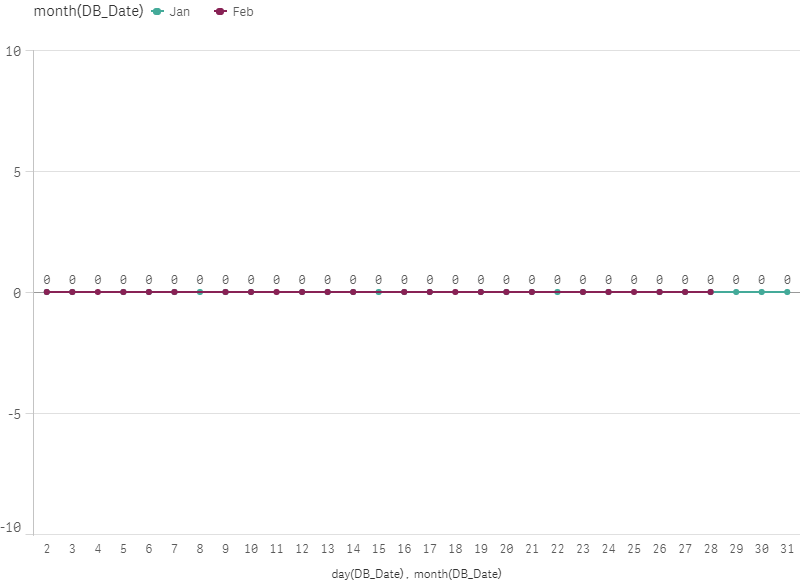
My result does not accumulate the values per day. If I remove a dimension day, i.e to display per month, it does accumulate per month.

My result per day:
Thank you in advance,
Mornay
- « Previous Replies
-
- 1
- 2
- Next Replies »
- Mark as New
- Bookmark
- Subscribe
- Mute
- Subscribe to RSS Feed
- Permalink
- Report Inappropriate Content
Hi Mornay
Try this :
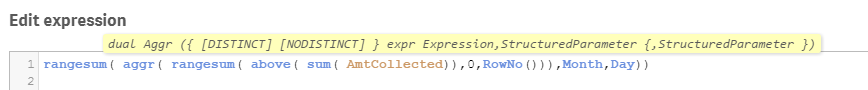
rangesum(
aggr(
rangesum(above(sum(AmtCollected)),0,RowNo()))
,Month,Day))
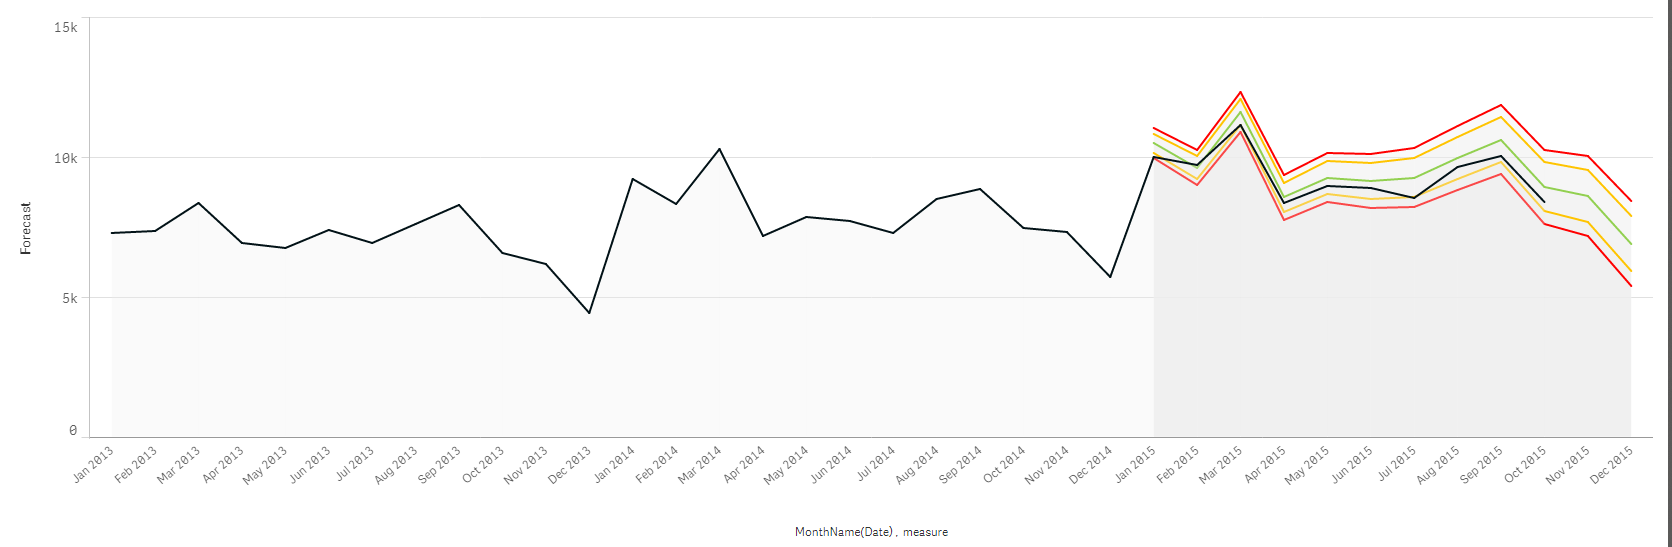
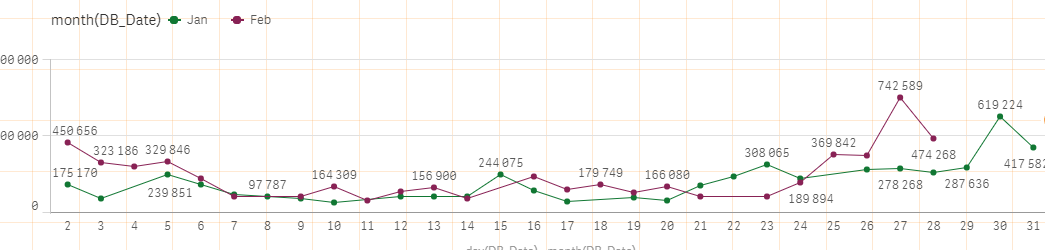
I test it with my own data it gave me this :
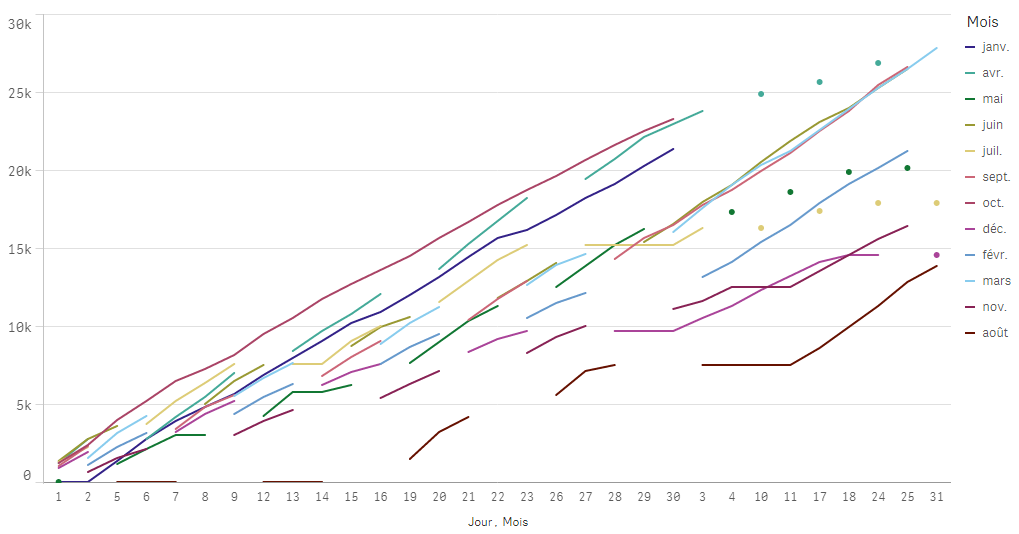
Regards
- Mark as New
- Bookmark
- Subscribe
- Mute
- Subscribe to RSS Feed
- Permalink
- Report Inappropriate Content
Hi Mornay,
You can use this to replicate the multi-line line chart above:
Please find the sample qvf attached.
Thanks,
Sangram.
- Mark as New
- Bookmark
- Subscribe
- Mute
- Subscribe to RSS Feed
- Permalink
- Report Inappropriate Content
Hi Bruno, thank you for you response. I have tried your expression, but I am receiving this error... Error in expression: Aggr takes at least 2 parameters
This is what I have tried:
and
Your chart is exactly what I need, but I am unable to replicate it. Could you perhaps attach the file for me?
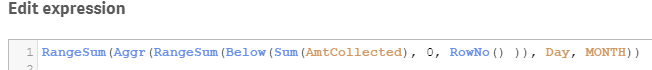
I have manage to add the expression, but now it only shows zero's...
rangesum( aggr( rangesum(below( sum(AmtCollected), 0, rowno() )), Day, MONTH ))
Thank you kindly
- Mark as New
- Bookmark
- Subscribe
- Mute
- Subscribe to RSS Feed
- Permalink
- Report Inappropriate Content
I think you will need to create Month and Day in your script so that you can use them in Aggr() function:
LOAD DB_Date,
Month(DB_Date) as MONTH,
Day(DB_Date) as Day
FROM ...
and then try this as your expression:
RangeSum(Aggr(RangeSum(Below(Sum(AmtCollected), 0, RowNo() )), Day, MONTH))
Another important this to ensure here to to sort the DB_Date correctly in order to get correct accumulation here. If the date isn't sorted in the script, you might run into errors.
- Mark as New
- Bookmark
- Subscribe
- Mute
- Subscribe to RSS Feed
- Permalink
- Report Inappropriate Content
Hi Sunny,
Unfortunately I did not come right with the accumulation. I have added the statement to my select statement, but It does not accumulate....
Thank you
- Mark as New
- Bookmark
- Subscribe
- Mute
- Subscribe to RSS Feed
- Permalink
- Report Inappropriate Content
I think the problem is that Above() and Below() work differently when you have multiple dimensions. You may need to use Above(TOTAL ...) in place of Above(...) and Below(TOTAL ...) in place of Below(..).
- Mark as New
- Bookmark
- Subscribe
- Mute
- Subscribe to RSS Feed
- Permalink
- Report Inappropriate Content
Hi Jonathan, nope still nothing
- Mark as New
- Bookmark
- Subscribe
- Mute
- Subscribe to RSS Feed
- Permalink
- Report Inappropriate Content
May be add TOTAL to RowNo() as well -> RowNo(TOTAL)
- Mark as New
- Bookmark
- Subscribe
- Mute
- Subscribe to RSS Feed
- Permalink
- Report Inappropriate Content
Hi
The wright order is Month,Day your wrote in your expression Day, Month
here is the good one :
rangesum(
aggr(
rangesum(above(sum(AmtCollected)),0,RowNo()))
,Month,Day))
don't use below with above
ensure you have in your script :
LOAD DB_Date,
Month(DB_Date) as MONTH,
Day(DB_Date) as Day
FROM ...
- « Previous Replies
-
- 1
- 2
- Next Replies »