Unlock a world of possibilities! Login now and discover the exclusive benefits awaiting you.
- Qlik Community
- :
- Forums
- :
- Analytics & AI
- :
- Products & Topics
- :
- Visualization and Usability
- :
- Accumulation Error
- Subscribe to RSS Feed
- Mark Topic as New
- Mark Topic as Read
- Float this Topic for Current User
- Bookmark
- Subscribe
- Mute
- Printer Friendly Page
- Mark as New
- Bookmark
- Subscribe
- Mute
- Subscribe to RSS Feed
- Permalink
- Report Inappropriate Content
Accumulation Error
Can someone tell me why the data in my line chart does not match the data in my table?
The dimensions and expressions are exactly the same.
Thanks,
Mike
Accepted Solutions
- Mark as New
- Bookmark
- Subscribe
- Mute
- Subscribe to RSS Feed
- Permalink
- Report Inappropriate Content
Try this:
Aggr(RangeSum(Above(SUM(count), 0, RowNo())), ([[Result Month]]], (NUMERIC)), ([Day of Month],(NUMERIC)))
- Mark as New
- Bookmark
- Subscribe
- Mute
- Subscribe to RSS Feed
- Permalink
- Report Inappropriate Content
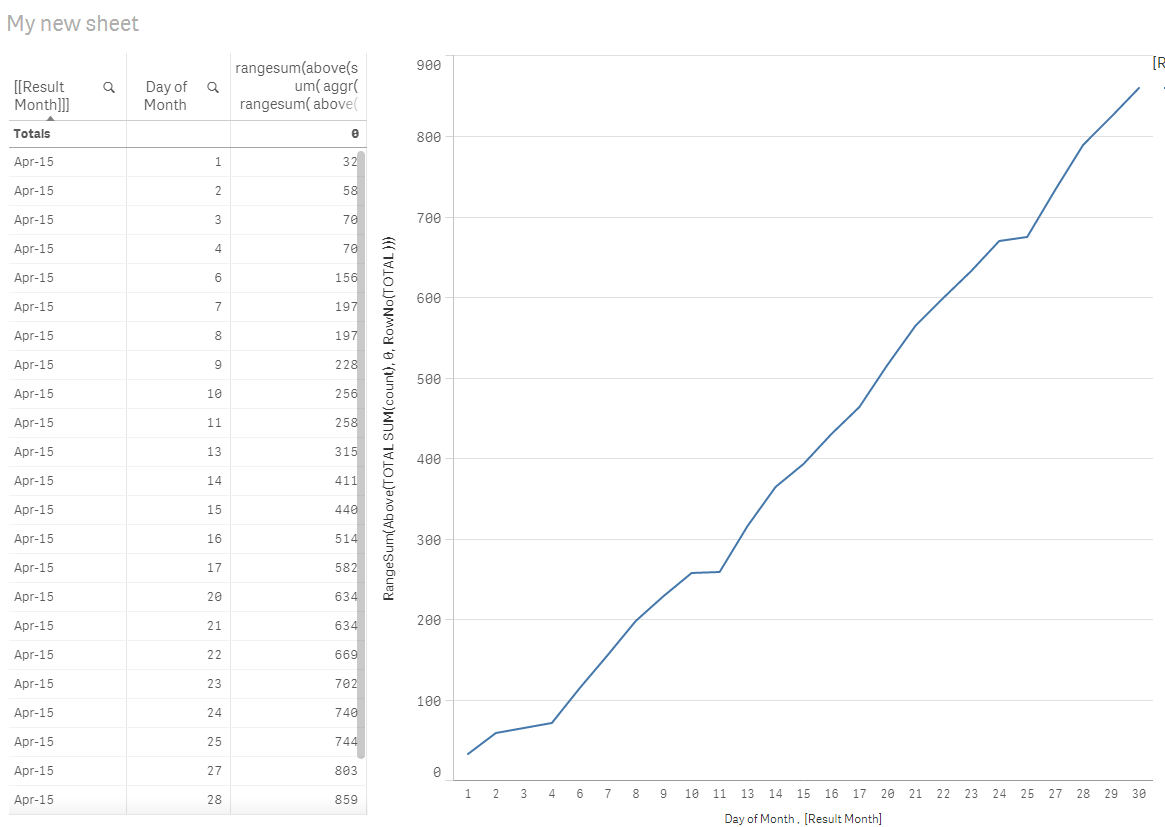
How about this:
RangeSum(Above(TOTAL SUM(count), 0, RowNo(TOTAL)))
- Mark as New
- Bookmark
- Subscribe
- Mute
- Subscribe to RSS Feed
- Permalink
- Report Inappropriate Content
Sunny,
Sorry, I gave you too simple of an example so this expression doesn't quite return what I need.
I have multiple months in my real data set.
Can you look at this new QVF and plot the values in the "My Values" table column to the line chart?
- Mark as New
- Bookmark
- Subscribe
- Mute
- Subscribe to RSS Feed
- Permalink
- Report Inappropriate Content
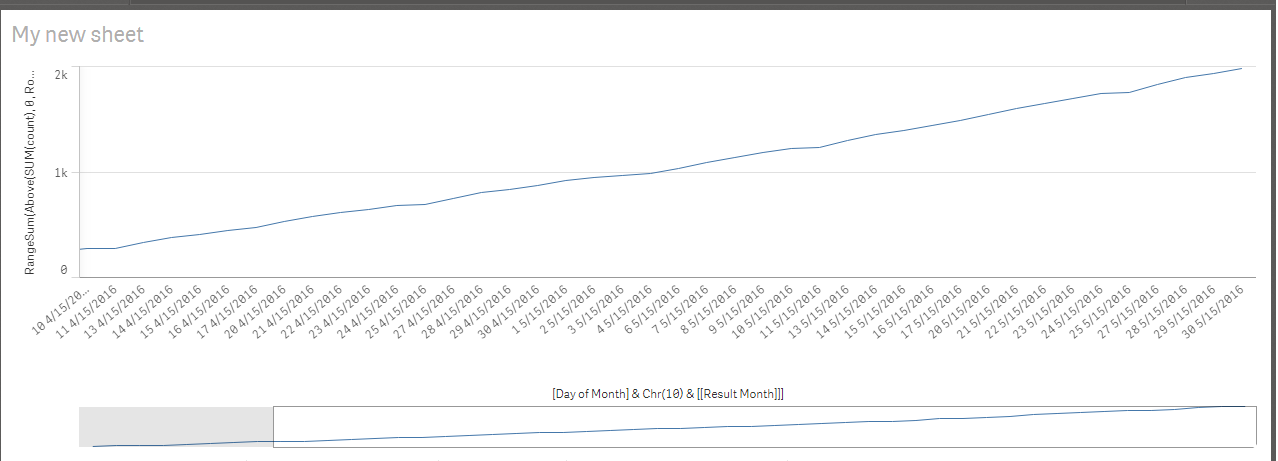
I think what you want to do is not possible with two dimensions. Why not use a concatenated dimension:
=[Day of Month] & Chr(10) & [[Result Month]]]
Expression:
RangeSum(Above(SUM(count), 0, RowNo()))
- Mark as New
- Bookmark
- Subscribe
- Mute
- Subscribe to RSS Feed
- Permalink
- Report Inappropriate Content
I need a month to month comparison so the concatenated dimension won't achieve what I need.
Thanks for looking it over!
Mike
- Mark as New
- Bookmark
- Subscribe
- Mute
- Subscribe to RSS Feed
- Permalink
- Report Inappropriate Content
Why did you close this discussion then?
What is the expected output? May be provide an Excel of expected output
- Mark as New
- Bookmark
- Subscribe
- Mute
- Subscribe to RSS Feed
- Permalink
- Report Inappropriate Content
Sorry, I thought you said it wasn't possible.
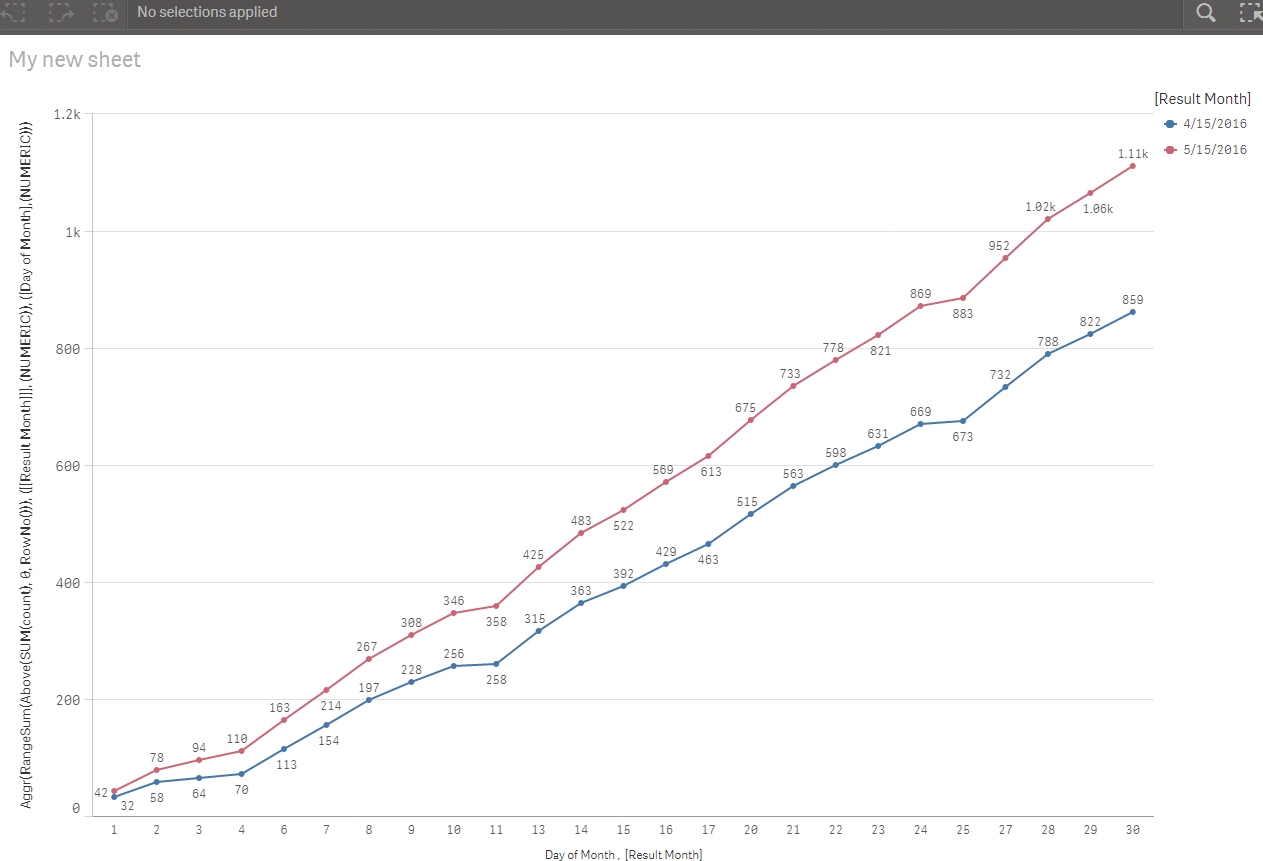
My desired output is two lines, one for each month, accumulating over the days of the month.
So the April line should accumulate from 32...859 and May should accumulate from 42..1109
- Mark as New
- Bookmark
- Subscribe
- Mute
- Subscribe to RSS Feed
- Permalink
- Report Inappropriate Content
Try this:
Aggr(RangeSum(Above(SUM(count), 0, RowNo())), ([[Result Month]]], (NUMERIC)), ([Day of Month],(NUMERIC)))
- Mark as New
- Bookmark
- Subscribe
- Mute
- Subscribe to RSS Feed
- Permalink
- Report Inappropriate Content
That was it Sunny. It's working now. It's strange to me that it needs that last aggr function.
I went down this rabbit hole due to another post: Comparison Graph
I have this need as well so i wanted to pursue a solution. If you want to correct my post for Comparison Graph, please do so, otherwise I'll make a correction to it in a little while.
Mike
- Mark as New
- Bookmark
- Subscribe
- Mute
- Subscribe to RSS Feed
- Permalink
- Report Inappropriate Content
I am out so won't be able to offer any help. But the reasons for both the dimension in the Aggr is due to the fact that both the Months have same days... 1, 2, 3, 4.... If you have unique field for each month... Then you might not need the two fields....