Unlock a world of possibilities! Login now and discover the exclusive benefits awaiting you.
- Qlik Community
- :
- All Forums
- :
- QlikView App Dev
- :
- How to create expression with 2 types of dimension...
- Subscribe to RSS Feed
- Mark Topic as New
- Mark Topic as Read
- Float this Topic for Current User
- Bookmark
- Subscribe
- Mute
- Printer Friendly Page
- Mark as New
- Bookmark
- Subscribe
- Mute
- Subscribe to RSS Feed
- Permalink
- Report Inappropriate Content
How to create expression with 2 types of dimension in same bar chart?
Hi ALL
I have the below expression which is working fine for each line of data I have. It compares QTY_STOCK for previous day with current day and then it counts the distinct number of POC_CODE as shown below:
(
count({$<Date={">=$(=max(Date)-1)<$(=Date)"}, Pivot_Item_Type = {'SUBST'}, Z_Active_For_Ava = {1}>} Distinct aggr(if( sum({$<Date={">=$(=max(Date)-1)<$(=Date)"},Pivot_Item_Type = {'SUBST'}, Z_Active_For_Ava = {1}>}QTY_STOCK) = 0,POC_CODE,null()), POC_CODE, SUBSTITUTION_ITEM))
/
Count({<Z_Active_For_Ava = {1}, Pivot_Item_Type = {'SUBST'}>}DISTINCT POC_CODE)
)
For my next requirement, I need to apply the same expression in a bar chart with Dimension = Date but as you can see Date is already present as a condition in the above expression.
That is in the bar chart graph I have to show the above expression results for the current selected Date and also for the past 45 days.
But as Date is already present in the above expression, how do I modify it to show the expression for the selected Date and for the past 45 days?
That is how do i include the following in my expression: <Date={">=$(=Date(max(Date)-45))<=$(=max(Date))"} >
Thanks for your help
- Mark as New
- Bookmark
- Subscribe
- Mute
- Subscribe to RSS Feed
- Permalink
- Report Inappropriate Content
Would you be able to share a sample with the expected output?
- Mark as New
- Bookmark
- Subscribe
- Mute
- Subscribe to RSS Feed
- Permalink
- Report Inappropriate Content
You can use Alternate States.
You can have two dates field with different states and can use in the expression respectively.
- Mark as New
- Bookmark
- Subscribe
- Mute
- Subscribe to RSS Feed
- Permalink
- Report Inappropriate Content
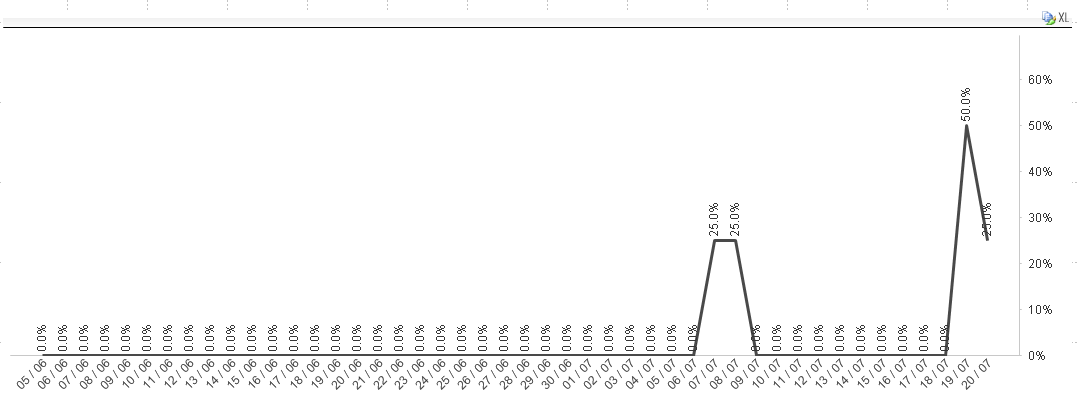
For example if I select date 20/07/2016 in the calendar, it should display me the bar chart below for the current Date = 20/07 and for the previous 45 days.
Currently, the below expression works fine for the Selected Date = 20/07 in table box.
(
count({$<Date={">=$(=max(Date)-1)<$(=Date)"}, Pivot_Item_Type = {'SUBST'}, Z_Active_For_Ava = {1}>} Distinct aggr(if( sum({$<Date={">=$(=max(Date)-1)<$(=Date)"},Pivot_Item_Type = {'SUBST'}, Z_Active_For_Ava = {1}>}QTY_STOCK) = 0,POC_CODE,null()), POC_CODE, SUBSTITUTION_ITEM))
/
Count({<Z_Active_For_Ava = {1}, Pivot_Item_Type = {'SUBST'}>}DISTINCT POC_CODE)
)
How do I make it display in the below bar chart with Dimension = Date for current Date as well as Date - 45 days that is <Date={">=$(=Date(max(Date)-45))<=$(=max(Date))"} >
?
- Mark as New
- Bookmark
- Subscribe
- Mute
- Subscribe to RSS Feed
- Permalink
- Report Inappropriate Content
Just simply write:
sum({$<Date={">=$(=Date(max(Date),45)<=$(=Date(max(Date))
- Mark as New
- Bookmark
- Subscribe
- Mute
- Subscribe to RSS Feed
- Permalink
- Report Inappropriate Content
Hello, thanks for your answer but I don't know how to implement this. I have tried so many expressions but its not working.
In My application, I have a calendar based on the field named as Date.
When I select one date in calendar for example 19/07/2016, I do get correct value for my selected date in the expression below:
count({$<Pivot_Item_Type = {'SUBST'}, Z_Active_For_Ava = {1}>} Distinct aggr(if( sum({$<Date={">=$(=max(Date)-1)<$(=Date)"},Pivot_Item_Type = {'SUBST'}, Z_Active_For_Ava = {1}>}QTY_STOCK) = 0,POC_CODE,null()), POC_CODE, SUBSTITUTION_ITEM))
My next requirement is that if I have selected the calendar = 19/07/2016, I need to build a bar chart which will show the value of the expressions starting 45 days ago that is Date - 45 till the selected Date = 19/07/2016.
That is Dimension of my bar chart will be Date.
Any idea how to do this? I have tried the following but it does not work:
Expression in bar chart:
=Count({$<Date={">=$(=Date(max(Date)-45))<=$(=max(Date))"} >}
Aggr(
count({$<Pivot_Item_Type = {'SUBST'}, Z_Active_For_Ava = {1}, Date={">=$(=Date(max(Date)-45))<=$(=max(Date))"}>} Distinct aggr(if( sum({$<Date={">=$(=max(Date)-1) <$(=max(Date))"},Pivot_Item_Type = {'SUBST'}, Z_Active_For_Ava = {1}>}QTY_STOCK) = 0,POC_CODE,null()), POC_CODE, SUBSTITUTION_ITEM))
, Date)
)
- Mark as New
- Bookmark
- Subscribe
- Mute
- Subscribe to RSS Feed
- Permalink
- Report Inappropriate Content
Hi Ashley,
I think this can work for you,
=Count({$<Date={">=$(=Date(max(Date),45))<=$(=max(Date))"} >}
Aggr(
count({$<Pivot_Item_Type = {'SUBST'}, Z_Active_For_Ava = {1}, Date={">=$(=Date(max(Date),45))<=$(=max(Date))"}>} Distinctaggr(if( sum({$<Date={">=$(=max(Date)-1) <$(=max(Date))"},Pivot_Item_Type = {'SUBST'}, Z_Active_For_Ava = {1}>}QTY_STOCK) = 0,POC_CODE,null()), POC_CODE, SUBSTITUTION_ITEM))
, Date)
)