Unlock a world of possibilities! Login now and discover the exclusive benefits awaiting you.
- Qlik Community
- :
- Forums
- :
- Analytics & AI
- :
- Products & Topics
- :
- App Development
- :
- Creating a retention table in qlik sense
- Subscribe to RSS Feed
- Mark Topic as New
- Mark Topic as Read
- Float this Topic for Current User
- Bookmark
- Subscribe
- Mute
- Printer Friendly Page
- Mark as New
- Bookmark
- Subscribe
- Mute
- Subscribe to RSS Feed
- Permalink
- Report Inappropriate Content
Creating a retention table in qlik sense
Hi,
I am trying to make a retention table in qlik sense and I am failing at it with multiple attempts.It would be great if someone could use the attached data and send me a QVF to solve this problem
mto kha isaaclin chooco_co
Output (which i want):-
The table says for example 10000 users came in Jan16, out of this 7530 came back in Feb and out of 10K 9K came back in Mar. Basically the numbers on the right are subset of the leftmost number
Note the numbers below are not exact and just a sample output
| Retention | Jan-16 | Feb-16 | Mar-16 | Apr-16 | May-16 | Jun-16 | Jul-16 | Aug-16 |
| Jan-16 | 10,000 | 7,530 | 9,000 | 5,306 | 782 | 6,958 | 7,113 | 3,464 |
| Feb-16 | 9,000 | 411 | 1,654 | 7,379 | 5,782 | 4,210 | 7,634 | |
| Mar-16 | 8,000 | 2,360 | 4,931 | 3,798 | 102 | 3,435 | ||
| Apr-16 | 8,800 | 4,656 | 2,234 | 1,339 | 4,235 | |||
| May-16 | 9,000 | 8,775 | 1,588 | 5,244 | ||||
| Jun-16 | 4,500 | 216 | 2,008 | |||||
| Jul-16 | 7,700 | 747 | ||||||
| Aug-16 | 2,232 |
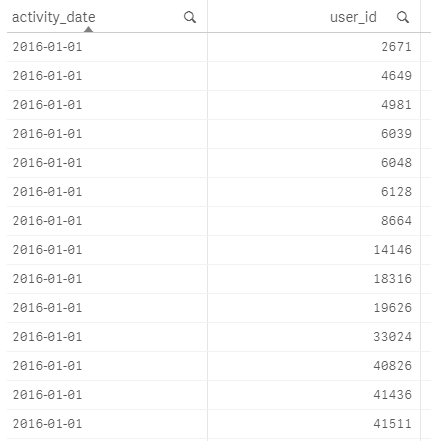
Data Available:-
The data is in the form of date and user_id (attached is the excel)
- Mark as New
- Bookmark
- Subscribe
- Mute
- Subscribe to RSS Feed
- Permalink
- Report Inappropriate Content
I am still figuring this out. It would be great to have a solution or a workaround
- Mark as New
- Bookmark
- Subscribe
- Mute
- Subscribe to RSS Feed
- Permalink
- Report Inappropriate Content
mto Any help here will be appreciated
- Mark as New
- Bookmark
- Subscribe
- Mute
- Subscribe to RSS Feed
- Permalink
- Report Inappropriate Content
Hi Vinol,
I use Qlikview, not Qliksense, but I have achieved exactly the same thing by:
1. Creating two tables, one with all the user activity and other with just the first activity per user (like Load user_id, min(date) from [activity table] group by user_id).
2. Then creating two calendars, one for each of the tables, that generate a separate Yearmonth variable for all the activity and the first activity.
3. Create a pivot table with the two yearmonth variables, and count(distinct(username)) as expression.
4. Drag one of the dimensions to columns according to your desired output.
Hope this helps!
Regards,
Jorge