Unlock a world of possibilities! Login now and discover the exclusive benefits awaiting you.
- Qlik Community
- :
- Forums
- :
- Analytics & AI
- :
- Products & Topics
- :
- Visualization and Usability
- :
- Highlight max min and negative values in a Pivot t...
- Subscribe to RSS Feed
- Mark Topic as New
- Mark Topic as Read
- Float this Topic for Current User
- Bookmark
- Subscribe
- Mute
- Printer Friendly Page
- Mark as New
- Bookmark
- Subscribe
- Mute
- Subscribe to RSS Feed
- Permalink
- Report Inappropriate Content
Highlight max min and negative values in a Pivot table
Hi all,
I'm struggling with highlighting the max min as well as negative values in a Pivot table.
My Pivot table looks like this 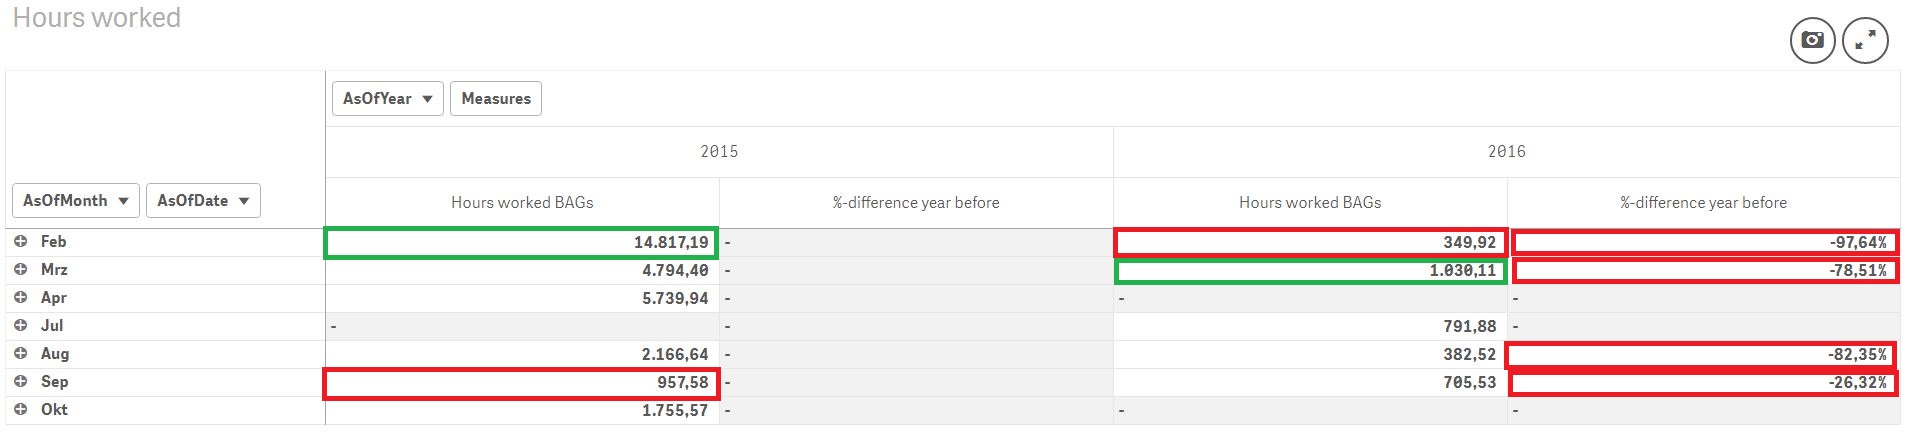
I am using multiple measures and I need to highlight them. The max value for "Hours worked" should be green. The min value for "Hours worked" should be red. In the %-difference year before all the negative values should be red.
I have looked through the discussions in here. But i couldn't find any solution with multiple measures.
I have added a sample.
Thank you for you help
Accepted Solutions
- Mark as New
- Bookmark
- Subscribe
- Mute
- Subscribe to RSS Feed
- Permalink
- Report Inappropriate Content
Hi
Like this
see attached app
For min / max hours : the mesure to add in the color panel is
if(rank( EXPRESSION) = 1, lightgreen(),
if(rank( -EXPRESSION) = 1, lightred()
)
where Expression is your actual mesure so that it's giving :
if(rank(
Sum({<Flag = {'Current Year'}>}N_LUGGAGE) /
sum ( {< FUNCTION_GROUP = {'operativ'}, [DIM_FUNCTION.WORKAREA] = {'GA'}, Flag = {'Current Year'} > } [DATE_ID-FACT_HOUR])
)=1,lightgreen(),
if(rank(-
Sum({<Flag = {'Current Year'}>}N_LUGGAGE) /
sum ( {< FUNCTION_GROUP = {'operativ'}, [DIM_FUNCTION.WORKAREA] = {'GA'}, Flag = {'Current Year'} > } [DATE_ID-FACT_HOUR])
)=1,lightred()
))
for % mesure : the mesure to add in the color panel is
if(
If(Sum({<Flag = {'Current Year'}>}N_LUGGAGE) /
sum ( {< FUNCTION_GROUP = {'operativ'}, [DIM_FUNCTION.WORKAREA] = {'GA'}, Flag = {'Current Year'} > } [DATE_ID-FACT_HOUR]) > 0,
(Sum({<Flag = {'Current Year'}>}N_LUGGAGE) /
sum ( {< FUNCTION_GROUP = {'operativ'}, [DIM_FUNCTION.WORKAREA] = {'GA'}, Flag = {'Current Year'} > } [DATE_ID-FACT_HOUR])) /
(Sum({<Flag = {'Previous Year'}>}N_LUGGAGE) /
sum ( {< FUNCTION_GROUP = {'operativ'}, [DIM_FUNCTION.WORKAREA] = {'GA'}, Flag = {'Previous Year'} > } [DATE_ID-FACT_HOUR]))-1)
<0,lightred(),lightgreen())

- Mark as New
- Bookmark
- Subscribe
- Mute
- Subscribe to RSS Feed
- Permalink
- Report Inappropriate Content
Hi,
use this formula for the background color of Hours Worked BAGs
If([Hours worked BAGs] = Max(Total <AsOfYear> Aggr(Sum({<Flag = {'Current Year'}>}N_LUGGAGE) / sum ( {< FUNCTION_GROUP = {'operativ'}, [DIM_FUNCTION.WORKAREA] = {'GA'}, Flag = {'Current Year'} > } [DATE_ID-FACT_HOUR]), AsOfYear, AsOfMonth))
,green()
,If([Hours worked BAGs] = Min(Total <AsOfYear> Aggr(Sum({<Flag = {'Current Year'}>}N_LUGGAGE) / sum ( {< FUNCTION_GROUP = {'operativ'}, [DIM_FUNCTION.WORKAREA] = {'GA'}, Flag = {'Current Year'} > } [DATE_ID-FACT_HOUR]), AsOfYear, AsOfMonth))
,red()
)
)
BR,
Matus
- Mark as New
- Bookmark
- Subscribe
- Mute
- Subscribe to RSS Feed
- Permalink
- Report Inappropriate Content
Hi
Like this
see attached app
For min / max hours : the mesure to add in the color panel is
if(rank( EXPRESSION) = 1, lightgreen(),
if(rank( -EXPRESSION) = 1, lightred()
)
where Expression is your actual mesure so that it's giving :
if(rank(
Sum({<Flag = {'Current Year'}>}N_LUGGAGE) /
sum ( {< FUNCTION_GROUP = {'operativ'}, [DIM_FUNCTION.WORKAREA] = {'GA'}, Flag = {'Current Year'} > } [DATE_ID-FACT_HOUR])
)=1,lightgreen(),
if(rank(-
Sum({<Flag = {'Current Year'}>}N_LUGGAGE) /
sum ( {< FUNCTION_GROUP = {'operativ'}, [DIM_FUNCTION.WORKAREA] = {'GA'}, Flag = {'Current Year'} > } [DATE_ID-FACT_HOUR])
)=1,lightred()
))
for % mesure : the mesure to add in the color panel is
if(
If(Sum({<Flag = {'Current Year'}>}N_LUGGAGE) /
sum ( {< FUNCTION_GROUP = {'operativ'}, [DIM_FUNCTION.WORKAREA] = {'GA'}, Flag = {'Current Year'} > } [DATE_ID-FACT_HOUR]) > 0,
(Sum({<Flag = {'Current Year'}>}N_LUGGAGE) /
sum ( {< FUNCTION_GROUP = {'operativ'}, [DIM_FUNCTION.WORKAREA] = {'GA'}, Flag = {'Current Year'} > } [DATE_ID-FACT_HOUR])) /
(Sum({<Flag = {'Previous Year'}>}N_LUGGAGE) /
sum ( {< FUNCTION_GROUP = {'operativ'}, [DIM_FUNCTION.WORKAREA] = {'GA'}, Flag = {'Previous Year'} > } [DATE_ID-FACT_HOUR]))-1)
<0,lightred(),lightgreen())
- Mark as New
- Bookmark
- Subscribe
- Mute
- Subscribe to RSS Feed
- Permalink
- Report Inappropriate Content
Hi Matus,
small question: I have applied your logic to my original data model:
What I had to change is the following:
If([Hours worked BAGs] = Max(Total <AsOfYear> Aggr(Sum({<Flag = {'Current Year'}>}N_LUGGAGE) / sum ( {< FUNCTION_GROUP = {'operativ'}, [DIM_FUNCTION.WORKAREA] = {'GA'}, Flag = {'Current Year'} > } [DATE_ID-FACT_HOUR]), AsOfYear, AsOfMonth))
,green()
,If([Hours worked BAGs] = Min(Total <AsOfYear> Aggr(Sum({<Flag = {'Current Year'}>}N_LUGGAGE) / sum ( {< FUNCTION_GROUP = {'operativ'}, [DIM_FUNCTION.WORKAREA] = {'GA'}, Flag = {'Current Year'} > } [DATE_ID-FACT_HOUR]), AsOfYear, AsOfMonth))
,red()
)
)
TO:
If([[Hours worked BAGs] = Max(Total <AsOfYear> Aggr(Sum({<Flag = {'2017'}>}N_LUGGAGE) / sum ( {< DF_FUNKTIONSGRUPPEN = {'operativ'}, DF_WORKAREA = {'GA'}, Flag = {'2017'} > } BU_BU_WERT_SUM), AsOfYear, AsOfMonth))
,green()
,If([[Hours worked BAGs] = Min(Total <AsOfYear> Aggr(Sum({<Flag = {'2017'}>}N_LUGGAGE) / sum ( {< DF_FUNKTIONSGRUPPEN = {'operativ'}, DF_WORKAREA = {'GA'}, Flag = {'2017'} > } BU_BU_WERT_SUM), AsOfYear, AsOfMonth))
,red()
)
)
It's the same logic as yours but I'm just using different field names. Current Year=2017 Previous Year=2016. Also I have years 2003 - 2017 (still no data for that). The strange thing is with this logic it won't highlight me the lowest value in 2016. It looks like this:
do you know why it won't work for 2015?
- Mark as New
- Bookmark
- Subscribe
- Mute
- Subscribe to RSS Feed
- Permalink
- Report Inappropriate Content
Hi Bruno,
could you explain me the logic behind this?
if(rank(
Sum({<Flag = {'Current Year'}>}N_LUGGAGE) /
sum ( {< FUNCTION_GROUP = {'operativ'}, [DIM_FUNCTION.WORKAREA] = {'GA'}, Flag = {'Current Year'} > } [DATE_ID-FACT_HOUR])
)=1,lightgreen(),
if(rank(-
Sum({<Flag = {'Current Year'}>}N_LUGGAGE) /
sum ( {< FUNCTION_GROUP = {'operativ'}, [DIM_FUNCTION.WORKAREA] = {'GA'}, Flag = {'Current Year'} > } [DATE_ID-FACT_HOUR])
)=1,lightred()
))
Also what's the meaning of "rank" and the "=1" at the end of each if statement?
If I change it to:
if(rank(
Sum({<Flag = {'2017'}>}N_LUGGAGE) /
sum ( {< DF_FUNKTIONSGRUPPEN = {'operativ'}, DF_WORKAREA = {'GA'}, Flag = {'2017'} > } BU_BU_WERT_SUM)
)=1,green(),
if(rank(-
Sum({<Flag = {'2017'}>}N_LUGGAGE) /
sum ( {< DF_FUNKTIONSGRUPPEN = {'operativ'}, DF_WORKAREA = {'GA'}, Flag = {'2017'} > } BU_BU_WERT_SUM)
)=2,lightred()
))
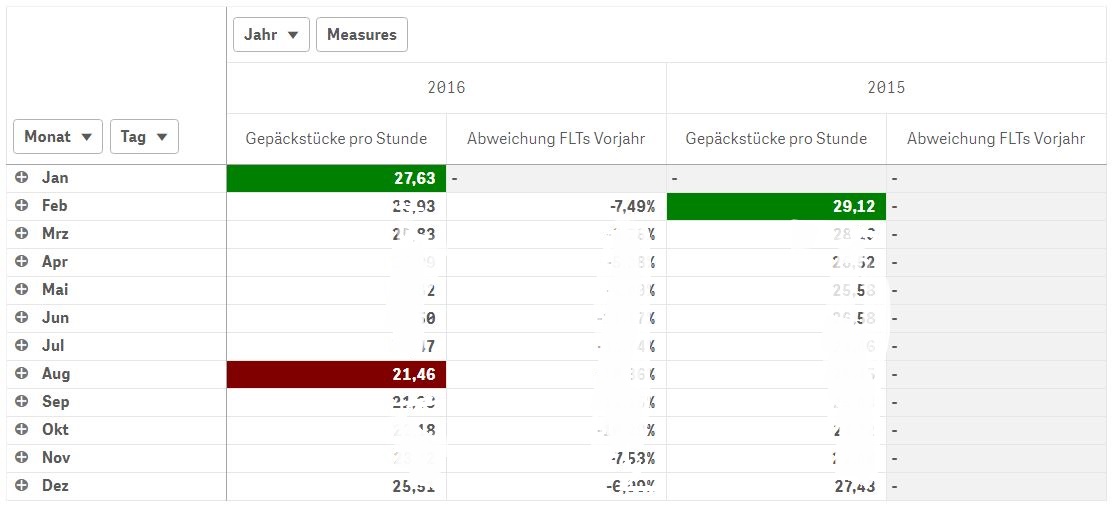
with both if statements at "=1" it doesn't show me the lowest value for 2015. It looks like my response to Matus.
If I put it to "=2" it shows me the second lowest value in 2016 and the lowest in 2015.
This is pretty weird
- Mark as New
- Bookmark
- Subscribe
- Mute
- Subscribe to RSS Feed
- Permalink
- Report Inappropriate Content
Did you change the expression in [Hours worked BAGs] the same way?
It would help if you can post the file again.
Matus
- Mark as New
- Bookmark
- Subscribe
- Mute
- Subscribe to RSS Feed
- Permalink
- Report Inappropriate Content
Hi
You need to higlight the Max Value and the Min Value in your table
Matus gets this by using Max and Min Functions in his formula. The expression used in the color panel need to be the same than the expression used in [Hours worked BAGs] column
My approach used the rank function the function Rank() evaluates the rows of the chart in the expression, and for each row, displays the relative position of the value of the dimension evaluated in the expression.
so the max value will be equal to 1 in the rank function = if(rank( EXPRESSION) = 1, lightgreen(),
I need now the min value, by using the minus sign before my expression i just reverse the order so the Min value will be equal to 1 also. like this : if(rank( - EXPRESSION) = 1, lightred(),
The EXPRESSION need to be the same than the mesure use.
if you use 2 , the rank function will return the second best result , if you use 3 , it will return the third result etc ...
You can do it also like this and avoid to copy past your formula by using the column() function in the rank like this
if(rank(
Column(1))=1,yellow(),
if(rank(-
Column(1))=1,Green()
))
it works and may be easier to use :

Bruno