Unlock a world of possibilities! Login now and discover the exclusive benefits awaiting you.
- Qlik Community
- :
- All Forums
- :
- QlikView
- :
- Evaluate Chart Expression at line level - Part3
- Subscribe to RSS Feed
- Mark Topic as New
- Mark Topic as Read
- Float this Topic for Current User
- Bookmark
- Subscribe
- Mute
- Printer Friendly Page
- Mark as New
- Bookmark
- Subscribe
- Mute
- Subscribe to RSS Feed
- Permalink
- Report Inappropriate Content
Evaluate Chart Expression at line level - Part3
Hello again,
I'm building upon an initial solution bystalwar1 that worked great untill now, but as business request changed, I'm having trouble changing the model to include this new requests.
The question I'm trying to answer, using a Chart (Straight or Pivot Table) layout, is the following:
1. Considering that we have a PRODUCT table where:
- one Brand has more than one Product
- one Product has more than one Pack,
- each Pack can be in more than one Sub-Markets (or Categories)
2. Considering that we have one FACT table where our measure is SALES_UNITS and our dimension are Pack, Store and a SALES_CONTRIBUTION (being a binary qualifying if the line is relevant for SALES calculations or not).
We want to know for each Product (or Brand, or Pack) on the Pivot table, what is the total Sales Units on the Product (dimension) respective Sub-Markets, but only on the stores that have sold (that have SALES_CONTRIBUTION =1) the product.
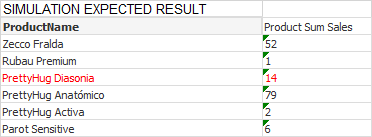
Something like this:
Product (dimension) | Sales Units (expression) |
Prod_A | Total Sales_Units of the Prod_A's Sub-Markets, on the Stores that sold Prod_A |
Prod_B | Total Sales_Units of the Prod_B's Sub-Markets, on the Stores that sold Prod_B |
Prod_C | … |
The general idea is to change dimensions dynamically on user selection, so the data model has to be flexible and dynamic, and preferably to use the same expression for all dimension levels.
Please see attached problem model.
Thank for your help.
Best Regards
Pedro Freire
- « Previous Replies
-
- 1
- 2
- Next Replies »
- Mark as New
- Bookmark
- Subscribe
- Mute
- Subscribe to RSS Feed
- Permalink
- Report Inappropriate Content
And I thought we were done 
- Mark as New
- Bookmark
- Subscribe
- Mute
- Subscribe to RSS Feed
- Permalink
- Report Inappropriate Content
With the model I published it worked fine.
However the solution mandates more flexibility on the dashboard side, so the problem was on the model I published, that allowed solutions on the script side.
If you remeber the first solution had something like this on the pivot line level:
=Sum(Aggr(Sum(TOTAL <Store, Market> SalesUnits), Store, ProdName, Market))
My solution must be more arround aggregations, with less work on the script side.
- Mark as New
- Bookmark
- Subscribe
- Mute
- Subscribe to RSS Feed
- Permalink
- Report Inappropriate Content
Hey Pedro... I will be working on this today...
- Mark as New
- Bookmark
- Subscribe
- Mute
- Subscribe to RSS Feed
- Permalink
- Report Inappropriate Content
Great!
I will be online, please let me know if I can be of any help.
- Mark as New
- Bookmark
- Subscribe
- Mute
- Subscribe to RSS Feed
- Permalink
- Report Inappropriate Content
The bookmarks on the 1st example where not showing the correct result.
For each ProductName or Brand they where showing all stores, and not only those who have sold the item
The file attached is the same QVW with the correct bookmarks.
Thank You
- Mark as New
- Bookmark
- Subscribe
- Mute
- Subscribe to RSS Feed
- Permalink
- Report Inappropriate Content
Don't think I know how to solve this without script intervention.... There is only one guy I can think of who might be able to resolve it -> swuehl. If he has time, I am sure he will respond back... else I am not sure what to tell you.
- Mark as New
- Bookmark
- Subscribe
- Mute
- Subscribe to RSS Feed
- Permalink
- Report Inappropriate Content
Thank you Sunny for your time I'll try swuehl, he has helped me in other situation in the past.
- Mark as New
- Bookmark
- Subscribe
- Mute
- Subscribe to RSS Feed
- Permalink
- Report Inappropriate Content
I must admit I didn't understand the problem - what's wrong or missing?
- Marcus
- Mark as New
- Bookmark
- Subscribe
- Mute
- Subscribe to RSS Feed
- Permalink
- Report Inappropriate Content
Hello Marcus,
Thank's for your attention!
The main question is:
What are the total Sum (SalesUnits) on the possible Sub-Markets only on the stores that sold the product.
Notes:
- Each Product can have more than one pack and each pack can be in more than one Sub-Market;
- The FACT table granularity is at pack level;
- Possible Sub-Markets are the ones the product belongs to;
- I've to present the information in a pivot chart, with product as a dimension, and with no selections made;
- This is a small model of the problem and the solution has to be integrated in a larger scale app so, the heavy work should be in the expression side, with small or no work on the script side.
So far we came up with something like this:
Sum(
Aggr(Sum(TOTAL <STOREID,[Sub-Market]> {<SALES_CONTRIBUTION={1}>} SALES_UNITS),[Sub-Market],STOREID,[ProductName]))
The problem is, when one product as more thas one pack, and each pack has a different Sub-Market, the expression only returns Sum(SalesUnits) of the Sub-Markets that have product's packs with sales, i.e.
if for some instance one of the pack of one product has no sale in one store, it will not sum the correspondent pack's Sub-Market, despite that the product belonging to that Sub-Market and it has sales of other packs.
in short, if i have a one-to-one relation between product and Sub-Market, the expression returns the correct result. If one product is in more than one Sub-Market I start to have problems...
Hope this wasn't a to messed up answer!
Best regards
Pedro Freire
- « Previous Replies
-
- 1
- 2
- Next Replies »