Unlock a world of possibilities! Login now and discover the exclusive benefits awaiting you.
- Qlik Community
- :
- All Forums
- :
- QlikView App Dev
- :
- Turn Min(Measure) into a Dimension
- Subscribe to RSS Feed
- Mark Topic as New
- Mark Topic as Read
- Float this Topic for Current User
- Bookmark
- Subscribe
- Mute
- Printer Friendly Page
- Mark as New
- Bookmark
- Subscribe
- Mute
- Subscribe to RSS Feed
- Permalink
- Report Inappropriate Content
Turn Min(Measure) into a Dimension
Hi,
I need to have a y-axis of Min(UnitPrice) on a GridChart.....
Is this possible? Is there some Qlik trickery I could employ to get this?
Thanks for any help
Phil
- « Previous Replies
-
- 1
- 2
- Next Replies »
Accepted Solutions
- Mark as New
- Bookmark
- Subscribe
- Mute
- Subscribe to RSS Feed
- Permalink
- Report Inappropriate Content
May be something along these lines
=Aggr(Min(UnitPrice), SomeDimension)
- Mark as New
- Bookmark
- Subscribe
- Mute
- Subscribe to RSS Feed
- Permalink
- Report Inappropriate Content
Not understanding, Will you provide snap shot
- Mark as New
- Bookmark
- Subscribe
- Mute
- Subscribe to RSS Feed
- Permalink
- Report Inappropriate Content
May be something along these lines
=Aggr(Min(UnitPrice), SomeDimension)
- Mark as New
- Bookmark
- Subscribe
- Mute
- Subscribe to RSS Feed
- Permalink
- Report Inappropriate Content
Hi Sunny,
This did the trick! Although, it only shows exact prices on the y-axis. Is it possible to scale the y-axis in distinct steps as a whole number just below the min and a whole number just above the max. So, if my values range from €10.30 to €76.76 my y-axis will start at €10.00 and increase in €5.00 steps to €80.00 ?
thansk again
Phil
- Mark as New
- Bookmark
- Subscribe
- Mute
- Subscribe to RSS Feed
- Permalink
- Report Inappropriate Content
You should be able to use a static min and static max for this on the presentation tab
Static min expression
Floor(Min(TOTAL Aggr(Min(UnitPrice), SomeDimension)), 5)
Static max expression
Ceil(Max(TOTAL Aggr(Min(UnitPrice), SomeDimension)), 5)
- Mark as New
- Bookmark
- Subscribe
- Mute
- Subscribe to RSS Feed
- Permalink
- Report Inappropriate Content
HI,
Thanks again for your reply. I have looked at th Presentation Tab and there doesn't seem to be an option to set the scale. Although on the axes tab the scale option has been disabled.
Any thoughts ?
Regards
Phil
- Mark as New
- Bookmark
- Subscribe
- Mute
- Subscribe to RSS Feed
- Permalink
- Report Inappropriate Content
My bad, I meant the Axes tab.... It is disabled on the axes tab? Can you share an image or axes tab?
- Mark as New
- Bookmark
- Subscribe
- Mute
- Subscribe to RSS Feed
- Permalink
- Report Inappropriate Content
of course :
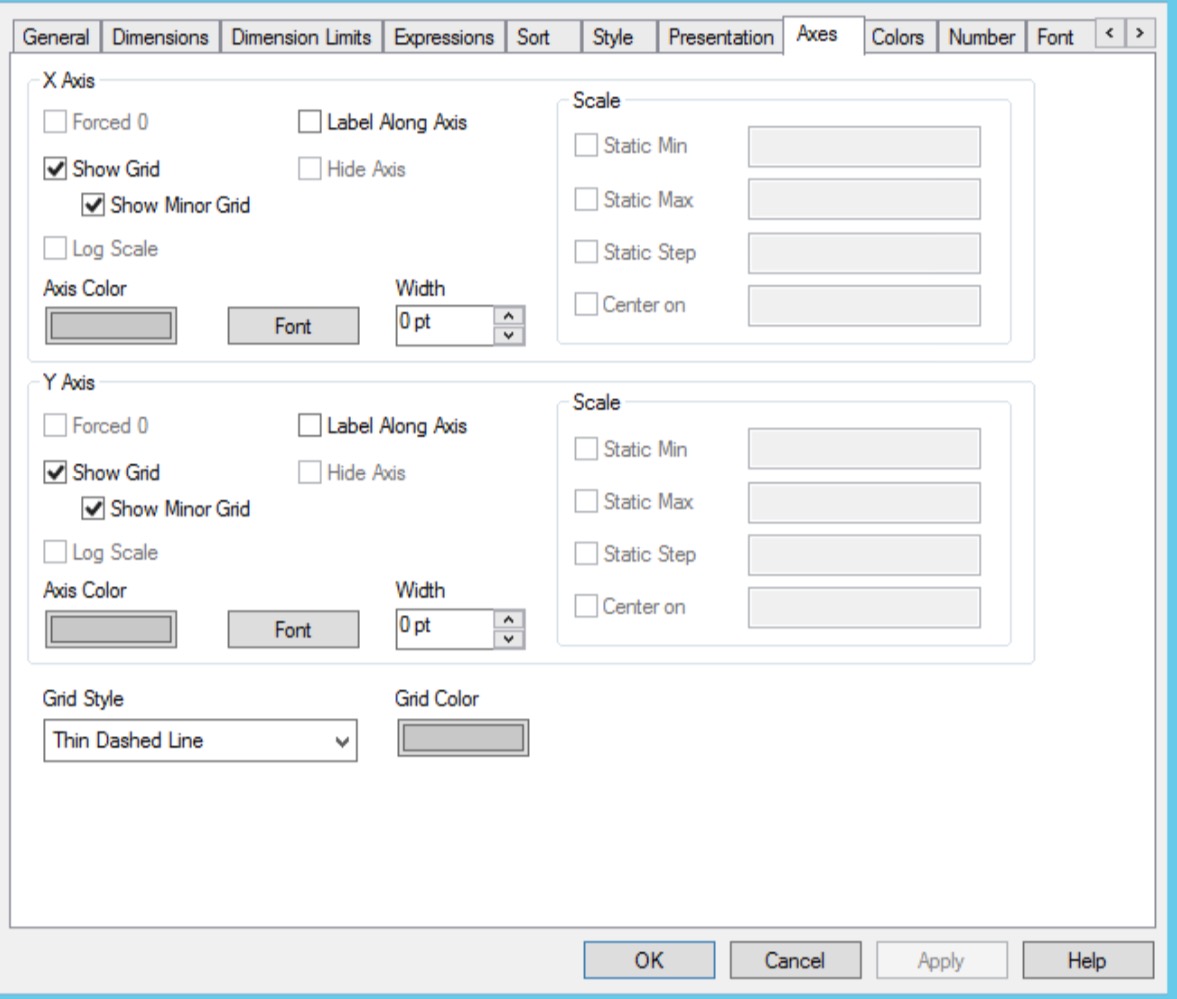
Regards,
phil
- Mark as New
- Bookmark
- Subscribe
- Mute
- Subscribe to RSS Feed
- Permalink
- Report Inappropriate Content
This is strange... is your chart detached by any chance?
- Mark as New
- Bookmark
- Subscribe
- Mute
- Subscribe to RSS Feed
- Permalink
- Report Inappropriate Content
ddefinitely not detache... it's a grid chart. does that make a difference?
- « Previous Replies
-
- 1
- 2
- Next Replies »