Unlock a world of possibilities! Login now and discover the exclusive benefits awaiting you.
- Qlik Community
- :
- All Forums
- :
- QlikView App Dev
- :
- how to show the total value of the region for each...
- Subscribe to RSS Feed
- Mark Topic as New
- Mark Topic as Read
- Float this Topic for Current User
- Bookmark
- Subscribe
- Mute
- Printer Friendly Page
- Mark as New
- Bookmark
- Subscribe
- Mute
- Subscribe to RSS Feed
- Permalink
- Report Inappropriate Content
how to show the total value of the region for each state?
Hello people
I need some help
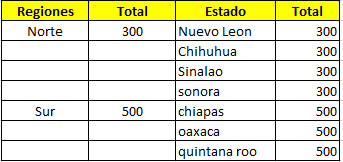
I am trying to do in a table when selecting a region that its total value shows in their respective states.
for example if I select North and has a value of 300 in one of my states that shows me the value of 300, both for Nuevo Leon, Chihuahua, etc.
the truth is not how to do that since it gives me the value for each different state and I only need the total value of the region for each state.
I leave an example of how to visualize the results, please do not know what help.
Thank you so much
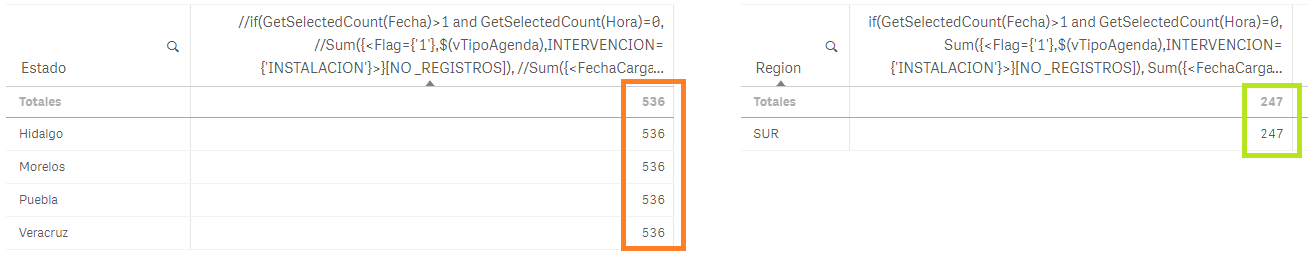
and that's how it is showing me
- Mark as New
- Bookmark
- Subscribe
- Mute
- Subscribe to RSS Feed
- Permalink
- Report Inappropriate Content
What is your expression that you use and what all dimensions are you using also?
- Mark as New
- Bookmark
- Subscribe
- Mute
- Subscribe to RSS Feed
- Permalink
- Report Inappropriate Content
look this is the expression of my states
if (GetSelectedCount> 1 and GetSelectedCount (Time) = 0,
Sum ({<Flag = {'1'}, $ (vTipoAgenda), INTERVENCION = {'INSTALACION'}}} TotalRegistrosRegion]),
Sum ({<ChargeDate = {'$ (= Max (ChargeDate))}}, $ (vTipoAgenda), INTERVENTION = {' INSTALLATION '}>} TotalRegionsRegion)
)
and for the regions is
if(GetSelectedCount(Fecha)>1 and GetSelectedCount(Hora)=0,
Sum({<Flag={'1'},$(vTipoAgenda),INTERVENCION={'INSTALACION'}>}[NO _REGISTROS]),
Sum({<FechaCarga={'$(=Max(FechaCarga))'}, $(vTipoAgenda),INTERVENCION={'INSTALACION'}>}[NO _REGISTROS])
)
If you see in the first expression the value of the field is called TotalRegistrosRegion, what I did is create a resident table and I bring the field [NO_REGISTROS], but to this field I apply the sum in the script, it is me shows other high results
in this image that I place the script, where I frame the green box is how I am linking my table, in the blue box I am grouping with the field that is linked to the table marked and finally in the box pink I show the sum of field fact and the renombro.
I hope this helps you visualize more what I'm doing
Thank you so much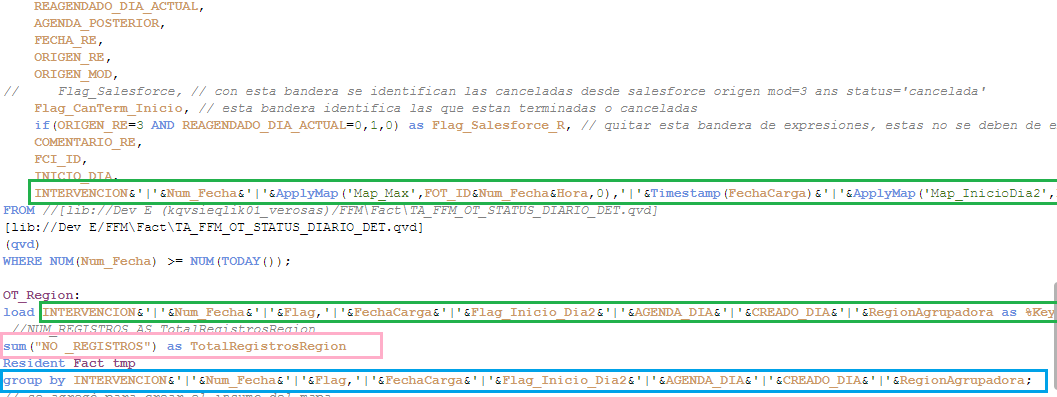
- Mark as New
- Bookmark
- Subscribe
- Mute
- Subscribe to RSS Feed
- Permalink
- Report Inappropriate Content
Is there you are doing the pre-aggregation in the script?
- Mark as New
- Bookmark
- Subscribe
- Mute
- Subscribe to RSS Feed
- Permalink
- Report Inappropriate Content
Yes it is
- Mark as New
- Bookmark
- Subscribe
- Mute
- Subscribe to RSS Feed
- Permalink
- Report Inappropriate Content
Sorry, I missed a few important words in my questions above... is there a REASON why you are doing pre-aggregation in the script?
- Mark as New
- Bookmark
- Subscribe
- Mute
- Subscribe to RSS Feed
- Permalink
- Report Inappropriate Content
I did it to see if I could give the total values I needed to see for each state, but I did not show them
- Mark as New
- Bookmark
- Subscribe
- Mute
- Subscribe to RSS Feed
- Permalink
- Report Inappropriate Content
Have you tried this as your expression for total at region level?
If(GetSelectedCount(Fecha) > 1 and GetSelectedCount(Hora) = 0,
Sum({<Flag={'1'}, $(vTipoAgenda), INTERVENCION = {'INSTALACION'}>} TOTAL <Regiones> [NO _REGISTROS]),
Sum({<FechaCarga={'$(=Max(FechaCarga))'}, $(vTipoAgenda),INTERVENCION={'INSTALACION'}>} TOTAL <Regiones> [NO _REGISTROS]))