Unlock a world of possibilities! Login now and discover the exclusive benefits awaiting you.
- Qlik Community
- :
- All Forums
- :
- QlikView App Dev
- :
- Linking Data from two tables
- Subscribe to RSS Feed
- Mark Topic as New
- Mark Topic as Read
- Float this Topic for Current User
- Bookmark
- Subscribe
- Mute
- Printer Friendly Page
- Mark as New
- Bookmark
- Subscribe
- Mute
- Subscribe to RSS Feed
- Permalink
- Report Inappropriate Content
Linking Data from two tables
I am trying to link the data from two tables
Table 1 - Sales Table
Table 2 - Complaints Table
Table 3 - Calendar
what I am Trying to do is list my Sales for a particular period, This could be a day, week, month or even year, what I would like to do is show how many complaints I have received for each sales line for that particular period so if there are no it should be 0.
Currently however I link them it will only show the line sales I have complaints for.
I would like to show all line sales + total complaints and calculate complaints per 100,000 for each line. Then Summarize the total sales and total complaints and calculate the complaints per 100000 in for everything
Table 1 - Sales Table
Sales Date
Sales Day
Line No,
Product Description
Registered Sales £,
Units Sold,
Reduced £,
Wastage £
Explained Wastage £
Reductions Sales £
Table 2 - Complaints Table
Customer
Line No,
Description
Complaint Date,
Date Bought,
Date Used,
Area, (type of Complaint ie bones, odour, damage etc)
Sub Area, (Category of Complaint ie quality, foreign body,)
Analysis Findings,
Status, (open, closed)
Branch No,
Branch name,
Table 3 - Calendar
Date
Accounting Year
Accounting Period
Accounting Day
Week Commencing
Week Ending
- Mark as New
- Bookmark
- Subscribe
- Mute
- Subscribe to RSS Feed
- Permalink
- Report Inappropriate Content
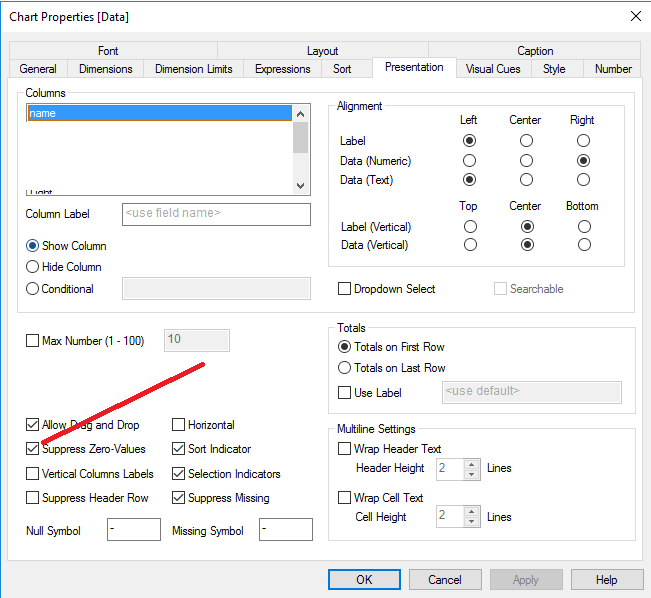
Hi,
In qlikview on presentation tab you can uncheck suppress zero value flag