Unlock a world of possibilities! Login now and discover the exclusive benefits awaiting you.
- Qlik Community
- :
- Forums
- :
- Analytics & AI
- :
- Products & Topics
- :
- Visualization and Usability
- :
- Need change the stacked Bar chart color in Red and...
- Subscribe to RSS Feed
- Mark Topic as New
- Mark Topic as Read
- Float this Topic for Current User
- Bookmark
- Subscribe
- Mute
- Printer Friendly Page
- Mark as New
- Bookmark
- Subscribe
- Mute
- Subscribe to RSS Feed
- Permalink
- Report Inappropriate Content
Need change the stacked Bar chart color in Red and Green
Hi am new of Qlik Sense,
Please help me , How to change the Stacked Bar Chart color. using expression or measure.
Above is our requirement,
- Tags:
- sushant
- Mark as New
- Bookmark
- Subscribe
- Mute
- Subscribe to RSS Feed
- Permalink
- Report Inappropriate Content
Hello,
One way is to create a master measure for each measure and you will be able to choose the color that you want
hope it helps

A.
- Mark as New
- Bookmark
- Subscribe
- Mute
- Subscribe to RSS Feed
- Permalink
- Report Inappropriate Content
- Mark as New
- Bookmark
- Subscribe
- Mute
- Subscribe to RSS Feed
- Permalink
- Report Inappropriate Content
Hello Bhaskar,
Did you manage to change the colors of your barchart ?
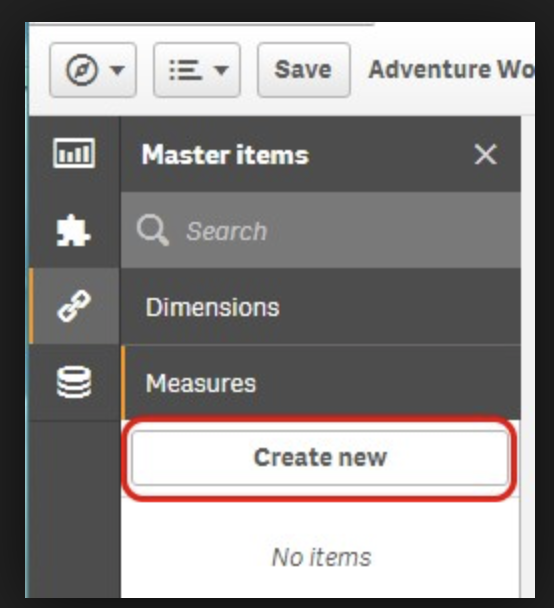
When you create your measure as a master Item you can set the color
Please find the screenshot below :
Then you can drag your measure into your bar Chart and replace your existing measure
- Mark as New
- Bookmark
- Subscribe
- Mute
- Subscribe to RSS Feed
- Permalink
- Report Inappropriate Content
Bar chart:
Dimension - [Project Code]
Measures - 1). Count([Counts of Green]) - Label - CountsofGreen
2). Count([Counts of Red]) - Label - CountsofRed
Appearance - Presentation - Stacked - Vertical
- Colors and legend - Custom - By Measure - Count([Counts of Green])
Select some other options - Done.
Change the expressions by requirement...
- Mark as New
- Bookmark
- Subscribe
- Mute
- Subscribe to RSS Feed
- Permalink
- Report Inappropriate Content
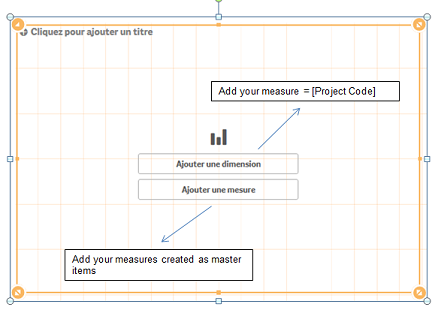
As I said you have to create two master item with your measures
then do the following :

No needs to configure the colors in the appearance panel as you set them when you created your master item measures
- Mark as New
- Bookmark
- Subscribe
- Mute
- Subscribe to RSS Feed
- Permalink
- Report Inappropriate Content
Thanks for your support. My color problem is resolve. but I want to show to Measure number in chart also which are show my attached pic.
- Mark as New
- Bookmark
- Subscribe
- Mute
- Subscribe to RSS Feed
- Permalink
- Report Inappropriate Content
hello,
sorry for the late answer
unfortunatly in qliksense you cannot show the values of each measure on a stacked bar chart
only the total is displayed
the only way is to choose the group option in the style tab
as you don’t have many values in your dimension it will still look ok
- Mark as New
- Bookmark
- Subscribe
- Mute
- Subscribe to RSS Feed
- Permalink
- Report Inappropriate Content
Please help me i have data in tabular format but how to showing this on qlik sense. like below