Unlock a world of possibilities! Login now and discover the exclusive benefits awaiting you.
- Qlik Community
- :
- Forums
- :
- Analytics
- :
- New to Qlik Analytics
- :
- Excel calcualtions help
- Subscribe to RSS Feed
- Mark Topic as New
- Mark Topic as Read
- Float this Topic for Current User
- Bookmark
- Subscribe
- Mute
- Printer Friendly Page
- Mark as New
- Bookmark
- Subscribe
- Mute
- Subscribe to RSS Feed
- Permalink
- Report Inappropriate Content
Excel calcualtions help
Hi Experts
Can any one please help me to calculate Calcolumn1,Calcolumn2, Calcolumn1% and Calcolumn2% in the below attached app.
Thanks in advance.
Accepted Solutions
- Mark as New
- Bookmark
- Subscribe
- Mute
- Subscribe to RSS Feed
- Permalink
- Report Inappropriate Content
Here is a way of doing it in Qlik Sense:
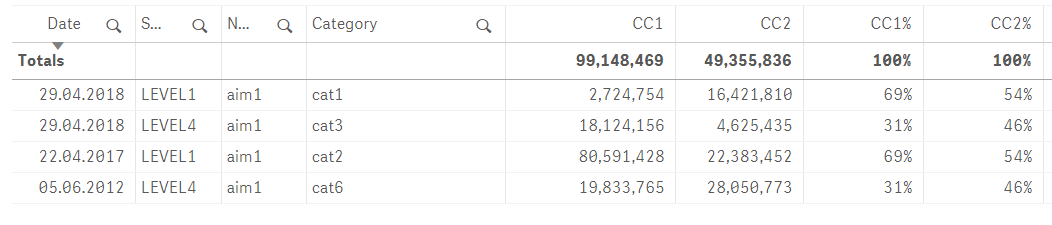
Calcolumn1:
=RangeMax(0,Sum(Value)) + RangeMax(Sum(Item1),Sum(Item2),Sum(Item3),Sum(Item4),Sum(Item5),Sum(Item6),Sum(Item7),Sum(Item8),Sum(Item9),Sum(Item10),Sum(Item11))/5+0.1
Calcolumn2:
=-RangeMin(0,Sum(Value)) + RangeMax(Sum(Item1),Sum(Item2),Sum(Item3),Sum(Item4),Sum(Item5),Sum(Item6),Sum(Item7),Sum(Item8),Sum(Item9),Sum(Item10),Sum(Item11))/5+0.1
Calcolumn1%:
Sum(TOTAL <SCOPE>
Aggr(
  RangeMax(0,Sum(Value)) + RangeMax(Sum(Item1),Sum(Item2),Sum(Item3),Sum(Item4),Sum(Item5),Sum(Item6),Sum(Item7),Sum(Item8),Sum(Item9),Sum(Item10),Sum(Item11))/5+0.1
, Date, SCOPE, Name, Category )
)
/
Sum(TOTAL
Aggr(
  RangeMax(0,Sum(Value)) + RangeMax(Sum(Item1),Sum(Item2),Sum(Item3),Sum(Item4),Sum(Item5),Sum(Item6),Sum(Item7),Sum(Item8),Sum(Item9),Sum(Item10),Sum(Item11))/5+0.1
, Date, SCOPE, Name, Category )
)
Calcolumn2%:
Sum(TOTAL <SCOPE>
Aggr(
  RangeMax(0,-Sum(Value)) + RangeMax(Sum(Item1),Sum(Item2),Sum(Item3),Sum(Item4),Sum(Item5),Sum(Item6),Sum(Item7),Sum(Item8),Sum(Item9),Sum(Item10),Sum(Item11))/5+0.1
, Date, SCOPE, Name, Category )
)
/
Sum(TOTAL
Aggr(
  RangeMax(0,-Sum(Value)) + RangeMax(Sum(Item1),Sum(Item2),Sum(Item3),Sum(Item4),Sum(Item5),Sum(Item6),Sum(Item7),Sum(Item8),Sum(Item9),Sum(Item10),Sum(Item11))/5+0.1
, Date, SCOPE, Name, Category )
)
I have attached the full example where the screenshot is taken from as a QVF-file for your testing...
I have taken the Excel table as is but I would highly recommend that this table should be unpivoted so the Item1...Item11 would appear as rows instead of columns in the table in Qlik Sense. Then the expressions in Qlik Sense would be different. I might give you a second Qlik Sense app to show how this is done - a little bit more evolved and a better solution in Qlik Sense to be honest.
- Mark as New
- Bookmark
- Subscribe
- Mute
- Subscribe to RSS Feed
- Permalink
- Report Inappropriate Content
The formulas in the post text does not align with the formulas in the attached Excel sheet. Could you please either update your explanation or the Excel sheet so the questions makes sense and is consistent?
- Mark as New
- Bookmark
- Subscribe
- Mute
- Subscribe to RSS Feed
- Permalink
- Report Inappropriate Content
Hi petter-s,
Thanks for your reply.
Sure I will try to update my text more clear.I am new to these calculations
Please consider the excel calculations only last 4 columns are the output columns which need to be calculated in Qlik.
Please help me on this.
Thanks in advance.
- Mark as New
- Bookmark
- Subscribe
- Mute
- Subscribe to RSS Feed
- Permalink
- Report Inappropriate Content
Here is a way of doing it in Qlik Sense:
Calcolumn1:
=RangeMax(0,Sum(Value)) + RangeMax(Sum(Item1),Sum(Item2),Sum(Item3),Sum(Item4),Sum(Item5),Sum(Item6),Sum(Item7),Sum(Item8),Sum(Item9),Sum(Item10),Sum(Item11))/5+0.1
Calcolumn2:
=-RangeMin(0,Sum(Value)) + RangeMax(Sum(Item1),Sum(Item2),Sum(Item3),Sum(Item4),Sum(Item5),Sum(Item6),Sum(Item7),Sum(Item8),Sum(Item9),Sum(Item10),Sum(Item11))/5+0.1
Calcolumn1%:
Sum(TOTAL <SCOPE>
Aggr(
  RangeMax(0,Sum(Value)) + RangeMax(Sum(Item1),Sum(Item2),Sum(Item3),Sum(Item4),Sum(Item5),Sum(Item6),Sum(Item7),Sum(Item8),Sum(Item9),Sum(Item10),Sum(Item11))/5+0.1
, Date, SCOPE, Name, Category )
)
/
Sum(TOTAL
Aggr(
  RangeMax(0,Sum(Value)) + RangeMax(Sum(Item1),Sum(Item2),Sum(Item3),Sum(Item4),Sum(Item5),Sum(Item6),Sum(Item7),Sum(Item8),Sum(Item9),Sum(Item10),Sum(Item11))/5+0.1
, Date, SCOPE, Name, Category )
)
Calcolumn2%:
Sum(TOTAL <SCOPE>
Aggr(
  RangeMax(0,-Sum(Value)) + RangeMax(Sum(Item1),Sum(Item2),Sum(Item3),Sum(Item4),Sum(Item5),Sum(Item6),Sum(Item7),Sum(Item8),Sum(Item9),Sum(Item10),Sum(Item11))/5+0.1
, Date, SCOPE, Name, Category )
)
/
Sum(TOTAL
Aggr(
  RangeMax(0,-Sum(Value)) + RangeMax(Sum(Item1),Sum(Item2),Sum(Item3),Sum(Item4),Sum(Item5),Sum(Item6),Sum(Item7),Sum(Item8),Sum(Item9),Sum(Item10),Sum(Item11))/5+0.1
, Date, SCOPE, Name, Category )
)
I have attached the full example where the screenshot is taken from as a QVF-file for your testing...
I have taken the Excel table as is but I would highly recommend that this table should be unpivoted so the Item1...Item11 would appear as rows instead of columns in the table in Qlik Sense. Then the expressions in Qlik Sense would be different. I might give you a second Qlik Sense app to show how this is done - a little bit more evolved and a better solution in Qlik Sense to be honest.
- Mark as New
- Bookmark
- Subscribe
- Mute
- Subscribe to RSS Feed
- Permalink
- Report Inappropriate Content
Hi petter-s
Thanks for your help.
After converting into cross table from Item 1 to Item 11 is this possible to do the same expressions in backend.
with percentage has to be aggregated by SCOPE Field.
,
- Mark as New
- Bookmark
- Subscribe
- Mute
- Subscribe to RSS Feed
- Permalink
- Report Inappropriate Content
I would think so.
- Mark as New
- Bookmark
- Subscribe
- Mute
- Subscribe to RSS Feed
- Permalink
- Report Inappropriate Content
Actually my first suggestion for a solution contained some grave errors - so I have updated the post with correct expressions and an updated QVF too. If you have already downloaded the QVF be sure to delete that one and download again to get a correct one...
- Mark as New
- Bookmark
- Subscribe
- Mute
- Subscribe to RSS Feed
- Permalink
- Report Inappropriate Content
It will be much much less flexible and rather convoluted too - but doable.