Unlock a world of possibilities! Login now and discover the exclusive benefits awaiting you.
- Qlik Community
- :
- All Forums
- :
- QlikView App Dev
- :
- How to use ranked objects obtained from one table ...
- Subscribe to RSS Feed
- Mark Topic as New
- Mark Topic as Read
- Float this Topic for Current User
- Bookmark
- Subscribe
- Mute
- Printer Friendly Page
- Mark as New
- Bookmark
- Subscribe
- Mute
- Subscribe to RSS Feed
- Permalink
- Report Inappropriate Content
How to use ranked objects obtained from one table in other charts?
Hello
The situation is that i obtain the top ranked products in one table and now i want to represent each ranked product figures in other charts and put it in a report.
Example: I have the top 10 products ranked like the picture below.
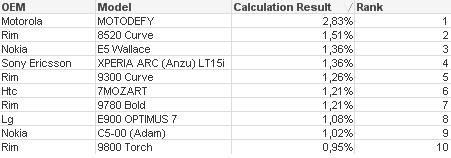
Now i want to represent the sales and other figures corresponding to each of the ranked products on other graphs/charts, one chart per ranked product in a report like below:
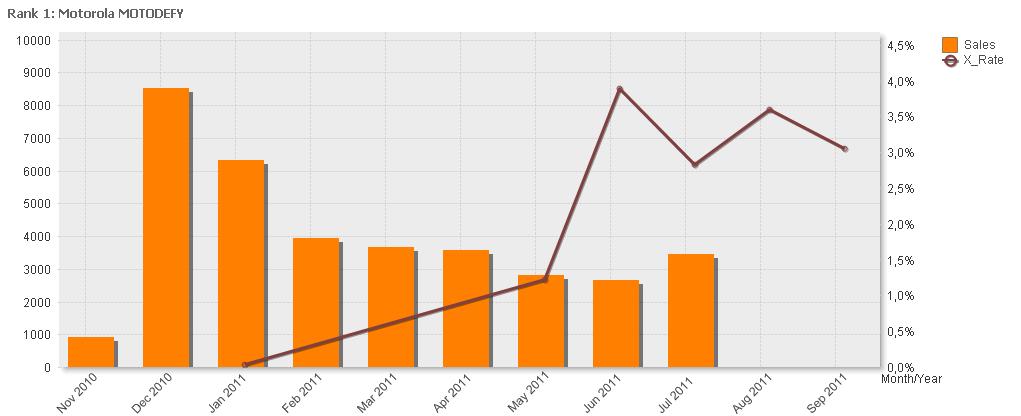
Therefore i need to generate 10 graphs (one graph per product per page) like the above in a report.
Can somebody please advice on how this can be done and by which method.
Thanks in advance,
Rajiv
- Mark as New
- Bookmark
- Subscribe
- Mute
- Subscribe to RSS Feed
- Permalink
- Report Inappropriate Content
Rajiv,
This is waht you can try. In your bar chart, add calculated dimension using the same expression as you use in the table for Rank. It may be more complex, but the logic should be the same. Next, use trellis for this bar chart.
- Mark as New
- Bookmark
- Subscribe
- Mute
- Subscribe to RSS Feed
- Permalink
- Report Inappropriate Content
I dont know what is ur actual requirement but if u want to generate the report for the product u have ranked
filter ur chart based on that product u have to do this 10 times as u said u want to generate 10 reports
for 10 different products
- Mark as New
- Bookmark
- Subscribe
- Mute
- Subscribe to RSS Feed
- Permalink
- Report Inappropriate Content
Hello Micheal,
I used the trellis in the chart dimension and made use of the ranked expression by selecting descending sort by expression in the sort section and the result is like below.

Its indeed something helpful, however i need to present each graph in a page on a report, is this possible? because if i do put this one whole graph in one page on a report, we cannot intepret rightly the figures as the axes are same.
Thanks again for the hint about the trellis
Rajiv
- Mark as New
- Bookmark
- Subscribe
- Mute
- Subscribe to RSS Feed
- Permalink
- Report Inappropriate Content
hello qliksus,
infact i want to generate the 10 graphs in 10 different pages in only one report.
Your idea will be my last last last resort 
regards,
Rajiv
- Mark as New
- Bookmark
- Subscribe
- Mute
- Subscribe to RSS Feed
- Permalink
- Report Inappropriate Content
Printing one graph on each page, with one product per page, and in one physical file - it can't be done without a macro. (I'll be glad to find I'm wrong.)
The macro should define the ranked products, select one product at a time, in a loop, and copy the chartinto the document after each selection. Probably MS Word document is the most convenient as an output for this purpose.
- Mark as New
- Bookmark
- Subscribe
- Mute
- Subscribe to RSS Feed
- Permalink
- Report Inappropriate Content
i'd be glad too if you could be wrong Micheal..
Am actually working on a macro which puts the ranked models obtained in an array and then i put that array in a randomly generated field for me to loop on that field in the report.
It took me lots of time to create that macro as its the first time am working with it. I need to run the macro before outputing on pdf and allow the loop on that field. It seems working.. hehe..