Unlock a world of possibilities! Login now and discover the exclusive benefits awaiting you.
- Qlik Community
- :
- All Forums
- :
- QlikView App Dev
- :
- Bar Chart with Static X Axis (Months)
- Subscribe to RSS Feed
- Mark Topic as New
- Mark Topic as Read
- Float this Topic for Current User
- Bookmark
- Subscribe
- Mute
- Printer Friendly Page
- Mark as New
- Bookmark
- Subscribe
- Mute
- Subscribe to RSS Feed
- Permalink
- Report Inappropriate Content
Bar Chart with Static X Axis (Months)
I have a table of data
| SalesGuy | Date | Sales |
|---|---|---|
| Person A | 1/1/2012 | 59 |
| Person B | 1/2/2012 | 32 |
| Person C | 2/1/2012 | 423 |
| Person A | 3/1/2012 | 234 |
etc
I have a bar chart which shows the total sales for each month, with Month(Date) as the Dimension, and Sum(Sales) as an expression. It looks good!
But I want this chart to change when i click a ListBox of my SalesGuys, so it shows the clicked persons sales. Problem is, if SalesGuy A doesnt sell anything in March, the months will redraw as JFAMJJASOND, when I want JFMAMJJASOND and 0 for March. Its not obvious that the month has been omitted.
Hoe can I fix this, to force all months to be shown?
I have tried "Show All Values" and Surpressing nulls etc with no luck.
Thanks in advance.
Accepted Solutions
- Mark as New
- Bookmark
- Subscribe
- Mute
- Subscribe to RSS Feed
- Permalink
- Report Inappropriate Content
I fixed it, perhaps it was a basic question.
I had to add Month(Date) as OffMonth to the script. Using that as my dimension, as opposed to Month (Date) works fine.
- Mark as New
- Bookmark
- Subscribe
- Mute
- Subscribe to RSS Feed
- Permalink
- Report Inappropriate Content
Try Unchecking "Suppress Zero-Values" under Presentation tab. Thats the only other thing I can think of.
Cheers
- Mark as New
- Bookmark
- Subscribe
- Mute
- Subscribe to RSS Feed
- Permalink
- Report Inappropriate Content
Hi,
See attached, is this what you are looking for ?
In addition to what Sandeep recommends you also need to check "Show all values" check box for the dimension.
Best Regards,
- Mark as New
- Bookmark
- Subscribe
- Mute
- Subscribe to RSS Feed
- Permalink
- Report Inappropriate Content
Hi,
Unchecking "Suppress Zero-Values" in Presentation tab works perfect.
Regards,
Jagan.
- Mark as New
- Bookmark
- Subscribe
- Mute
- Subscribe to RSS Feed
- Permalink
- Report Inappropriate Content
I fixed it, perhaps it was a basic question.
I had to add Month(Date) as OffMonth to the script. Using that as my dimension, as opposed to Month (Date) works fine.
- Mark as New
- Bookmark
- Subscribe
- Mute
- Subscribe to RSS Feed
- Permalink
- Report Inappropriate Content
Hello, I know this is a older post, but I have a Question.
When I try to use a average trend line in your archive, this is the result: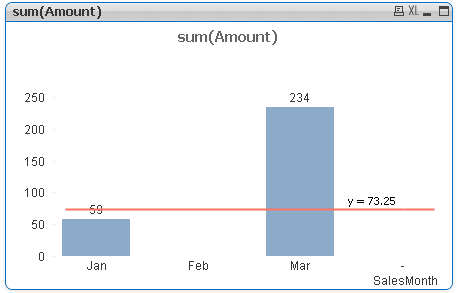
Why this happens?, the total result is divided by 4 and not by 3 (January, February, March).
Is there a way that takes only the number of values that really exist?.