Unlock a world of possibilities! Login now and discover the exclusive benefits awaiting you.
- Qlik Community
- :
- All Forums
- :
- QlikView App Dev
- :
- Max date of report
- Subscribe to RSS Feed
- Mark Topic as New
- Mark Topic as Read
- Float this Topic for Current User
- Bookmark
- Subscribe
- Mute
- Printer Friendly Page
- Mark as New
- Bookmark
- Subscribe
- Mute
- Subscribe to RSS Feed
- Permalink
- Report Inappropriate Content
Max date of report
I want to make a bar chart that is displaying the most recent modify date of my list of reports.
How would I go about doing this?
Right now I have lastmodifydate as my dimension with my expression of a count of reports. but what I want to see is a count of the most recent modify date of each report because I have mutiple records for each time a report is modified.
Thanks
- Mark as New
- Bookmark
- Subscribe
- Mute
- Subscribe to RSS Feed
- Permalink
- Report Inappropriate Content
Assuming your dimensions are reportname and lastmodifydate, try:
=aggr(max(lastmodifydate),reportname)
talk is cheap, supply exceeds demand
- Mark as New
- Bookmark
- Subscribe
- Mute
- Subscribe to RSS Feed
- Permalink
- Report Inappropriate Content
that did not work as an expression
- Mark as New
- Bookmark
- Subscribe
- Mute
- Subscribe to RSS Feed
- Permalink
- Report Inappropriate Content
any other ideas?
I just want to restrict the data in the bar chart to count only a single record of the report that has the highest date value.
- Mark as New
- Bookmark
- Subscribe
- Mute
- Subscribe to RSS Feed
- Permalink
- Report Inappropriate Content
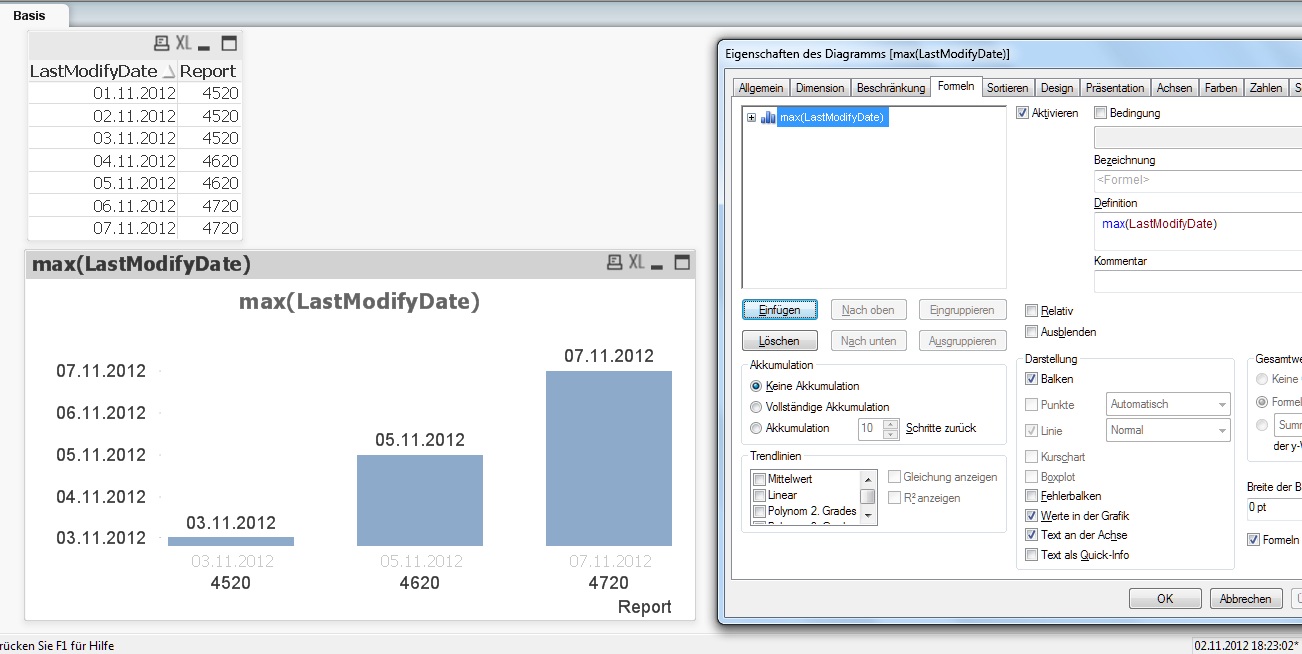
Hi,
just add as Dimension the Report and as Expression: max(LastModifyDate)