Unlock a world of possibilities! Login now and discover the exclusive benefits awaiting you.
- Qlik Community
- :
- All Forums
- :
- QlikView App Dev
- :
- fix colours
- Subscribe to RSS Feed
- Mark Topic as New
- Mark Topic as Read
- Float this Topic for Current User
- Bookmark
- Subscribe
- Mute
- Printer Friendly Page
- Mark as New
- Bookmark
- Subscribe
- Mute
- Subscribe to RSS Feed
- Permalink
- Report Inappropriate Content
fix colours
Afternoon
I have a number of bar charts which display values for the regions in our company. How do I fix these to be a certain colour
i.e. North = Blue, Scotland = Red etc. I know what the rgb values. I've been trying to put an expression in the colors tab but it doesnt seem to be working
Can someone advise
Thanks
- Tags:
- new_to_qlikview
Accepted Solutions
- Mark as New
- Bookmark
- Subscribe
- Mute
- Subscribe to RSS Feed
- Permalink
- Report Inappropriate Content
HI
In expression tab, click the '+' sign and try like this
=Pick(Match(only(FieldName),'North','Scotland'),blue(),red())
Hope it helps
Please close the thread by marking correct answer & give likes if you like the post.
- Mark as New
- Bookmark
- Subscribe
- Mute
- Subscribe to RSS Feed
- Permalink
- Report Inappropriate Content
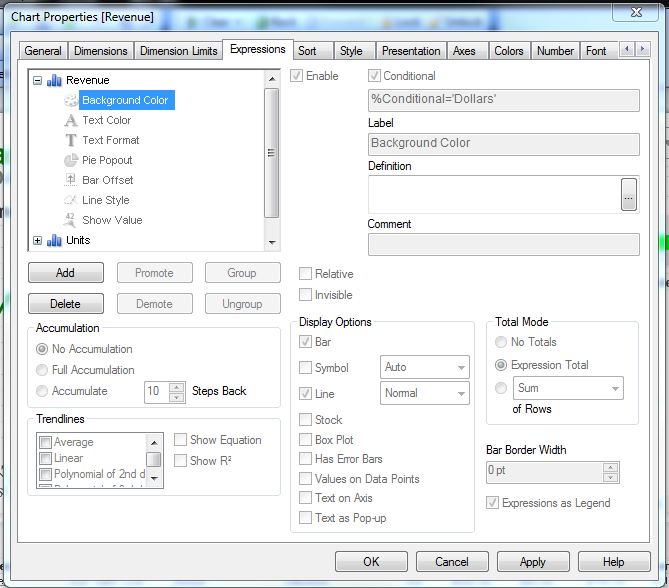
Under Expressions > Background Color, write your expression.
- Mark as New
- Bookmark
- Subscribe
- Mute
- Subscribe to RSS Feed
- Permalink
- Report Inappropriate Content
For example:
If(Region = 'North', RGB(0,0,255),
if(Region = 'Scotland', RGB(255,0,0))
- Mark as New
- Bookmark
- Subscribe
- Mute
- Subscribe to RSS Feed
- Permalink
- Report Inappropriate Content
HI
In expression tab, click the '+' sign and try like this
=Pick(Match(only(FieldName),'North','Scotland'),blue(),red())
Hope it helps
Please close the thread by marking correct answer & give likes if you like the post.
- Mark as New
- Bookmark
- Subscribe
- Mute
- Subscribe to RSS Feed
- Permalink
- Report Inappropriate Content
Check Henric's recent blog post on how to use consistent colors across multiple charts:
http://community.qlik.com/blogs/qlikviewdesignblog/2012/12/04/colors-in-charts
- Mark as New
- Bookmark
- Subscribe
- Mute
- Subscribe to RSS Feed
- Permalink
- Report Inappropriate Content
Thank you all for a prompt response - all sorted now 