Unlock a world of possibilities! Login now and discover the exclusive benefits awaiting you.
- Qlik Community
- :
- All Forums
- :
- QlikView App Dev
- :
- Table Values Average - Aggregation
- Subscribe to RSS Feed
- Mark Topic as New
- Mark Topic as Read
- Float this Topic for Current User
- Bookmark
- Subscribe
- Mute
- Printer Friendly Page
- Mark as New
- Bookmark
- Subscribe
- Mute
- Subscribe to RSS Feed
- Permalink
- Report Inappropriate Content
Table Values Average - Aggregation
Hi all,
I have only very recently began learning QlikView and need some help with the following table:
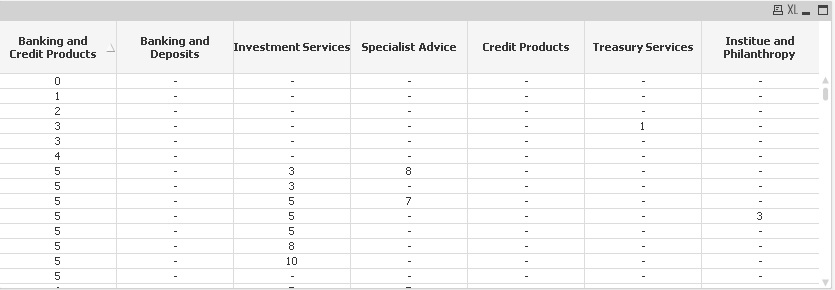
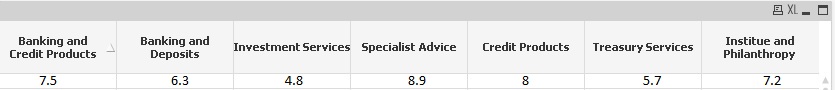
As it stands the responses are showing one row per response. So each column shows each individual score - what I need is an average - so that the table will look like this:
Is this possible with an expression/aggregation? Will the null values affect the average?
Please bear in mind that I'm pretty much a beginner, so try to keep the explanations simple!
Any help is much appreciated.
Message was edited by: smoore009 14:41
Accepted Solutions
- Mark as New
- Bookmark
- Subscribe
- Mute
- Subscribe to RSS Feed
- Permalink
- Report Inappropriate Content
I assume you are using ResponseID or something similar as dimension.
And then just the field names like [Credit Products] as expression or ...?
Try creating a straight table chart with no dimension and as expressions
=avg([Credit Products])
=avg([Banking and Deposits])
etc.
- Mark as New
- Bookmark
- Subscribe
- Mute
- Subscribe to RSS Feed
- Permalink
- Report Inappropriate Content
That has worked perfectly, thanks!