Unlock a world of possibilities! Login now and discover the exclusive benefits awaiting you.
- Qlik Community
- :
- All Forums
- :
- QlikView
- :
- Google maps API key signup
- Subscribe to RSS Feed
- Mark Topic as New
- Mark Topic as Read
- Float this Topic for Current User
- Bookmark
- Subscribe
- Mute
- Printer Friendly Page
- Mark as New
- Bookmark
- Subscribe
- Mute
- Subscribe to RSS Feed
- Permalink
- Report Inappropriate Content
Google maps API key signup
Hi,
Can you please advise which services need to be selected in order to sign up for Google Maps API key and use that key in QlikView to develop geographical maps?
I signed up for below services.. am only interested in showing regiona/country maps based on user selections..
After signup, I am using below URL as Dynamic Image in Colors tab -
This link, when tried directly on browser, gives below error -
This web site needs a different Google Maps API key. A new key can be generated at http://code.google.com/apis/maps/.
Appreciate any help to resolve this key issue..
- « Previous Replies
-
- 1
- 2
- Next Replies »
Accepted Solutions
- Mark as New
- Bookmark
- Subscribe
- Mute
- Subscribe to RSS Feed
- Permalink
- Report Inappropriate Content
You can use both Google Maps API v2 or v3, but the v2 will be discontinued soon.
The URL error is mentioned and solucionated here: http://community.qlik.com/message/321080#321080
Your color code should be something like this:
='http://maps.google.com/maps/api/staticmap?center='
&
num(var_mid_lat, '##############', '.', ',' )
&
','
&
num(var_mid_long, '##############', '.', ',' )
&
'&zoom=$(var_zoom)'
&
'&maptype='&var_maptype
&
'&size='&map_size_x&'x'&map_size_y
&
'&key='&gmap_key & '&sensor=false'
Regards,
- Mark as New
- Bookmark
- Subscribe
- Mute
- Subscribe to RSS Feed
- Permalink
- Report Inappropriate Content
Perfect.. thanks!
- Mark as New
- Bookmark
- Subscribe
- Mute
- Subscribe to RSS Feed
- Permalink
- Report Inappropriate Content
Dear julian.rodriguez
Thank you very much, the google maps now works.
But there is still a problem:
If you select some values (draw an rectangle over the map), the map doesn't zoom in, like it did before.
I hope u can help me/us.
Kind regards.
Simon
- Mark as New
- Bookmark
- Subscribe
- Mute
- Subscribe to RSS Feed
- Permalink
- Report Inappropriate Content
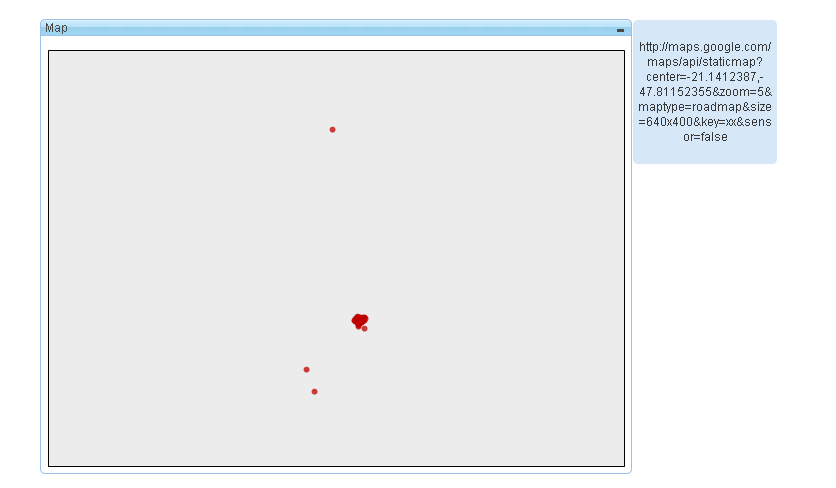
Hi
I made the changes but the map does not appear.
See!
='http://maps.google.com/maps/api/staticmap?center='
&
num(var_mid_lat, '##############', '.', ',' )
&
','
&
num(var_mid_long, '##############', '.', ',' )
&
'&zoom=$(var_zoom)'
&
'&maptype='&var_maptype
&
'&size='&map_size_x&'x'&map_size_y
&
'&key='&gmap_key & '&sensor=false'
- Mark as New
- Bookmark
- Subscribe
- Mute
- Subscribe to RSS Feed
- Permalink
- Report Inappropriate Content
Alex:
You must change the value of the variable gmap_key
On this moment you have 'xx' for this variable.
You should change it with a new API v3 valid key. You should go to https://developers.google.com/maps/documentation/javascript/tutorial#api_key and follow the instructions.
Regards
- Mark as New
- Bookmark
- Subscribe
- Mute
- Subscribe to RSS Feed
- Permalink
- Report Inappropriate Content
Julian:
ve changed the variable gmap_key = AIzaSyAABZIVacmXaH_m5XNM2PzcJo3uDr12Rzk but does not work.
When I put the string in the browser works
Regards
- Mark as New
- Bookmark
- Subscribe
- Mute
- Subscribe to RSS Feed
- Permalink
- Report Inappropriate Content
Well, this is weird....
I can't imagine what other problem could you have.
Is it possible to attach a mini version of your document? with only the chart you are having problems?
- Mark as New
- Bookmark
- Subscribe
- Mute
- Subscribe to RSS Feed
- Permalink
- Report Inappropriate Content
Yes, the document is the link http://www.sendspace.com/file/lfaz3y
Regards
- Mark as New
- Bookmark
- Subscribe
- Mute
- Subscribe to RSS Feed
- Permalink
- Report Inappropriate Content
May be sounds as a fool's question, but did you reload the document after changing the variable?
I have changed the chart with your key value and it works ...
See the attachment
- « Previous Replies
-
- 1
- 2
- Next Replies »