Unlock a world of possibilities! Login now and discover the exclusive benefits awaiting you.
- Qlik Community
- :
- All Forums
- :
- QlikView App Dev
- :
- showing label and values on the top of scattered b...
- Subscribe to RSS Feed
- Mark Topic as New
- Mark Topic as Read
- Float this Topic for Current User
- Bookmark
- Subscribe
- Mute
- Printer Friendly Page
- Mark as New
- Bookmark
- Subscribe
- Mute
- Subscribe to RSS Feed
- Permalink
- Report Inappropriate Content
showing label and values on the top of scattered bubble
Hi.. I'm new to QV and trying to get along with it on scattered chart.
Can you guys tell me how to display label of the city on the top of each bubble in a scattered chart.
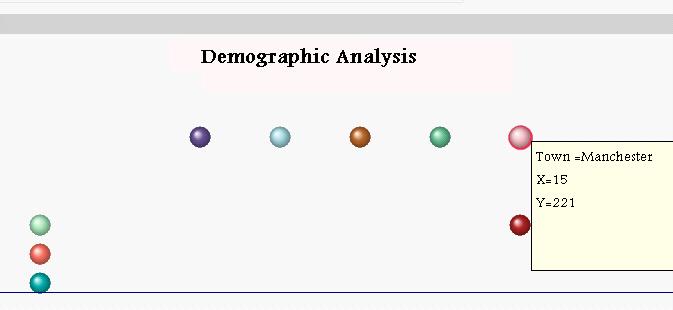
What I have now:
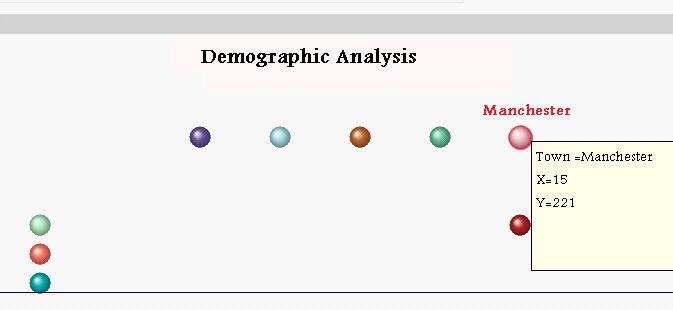
What I need (showing the town name "Manchester"):
Your help is really appreciated.
Thanks alot!
A
Accepted Solutions
- Mark as New
- Bookmark
- Subscribe
- Mute
- Subscribe to RSS Feed
- Permalink
- Report Inappropriate Content
In properties->presentation, check "Labels On DataPoints"
- Mark as New
- Bookmark
- Subscribe
- Mute
- Subscribe to RSS Feed
- Permalink
- Report Inappropriate Content
In properties->presentation, check "Labels On DataPoints"
- Mark as New
- Bookmark
- Subscribe
- Mute
- Subscribe to RSS Feed
- Permalink
- Report Inappropriate Content
I have the same issue. When I select "Labels on DataPoints" I do not get the text I want but instead a number.
I have three dimensions, X-axes, Y-axes and a label.
I have the three dimensions again in expressions plus an extra fourth expression (price) that determines the size of the bubble.
I can't seem to configure it so that the correct label is displayed. Any help appreciated.
- Mark as New
- Bookmark
- Subscribe
- Mute
- Subscribe to RSS Feed
- Permalink
- Report Inappropriate Content
If there are too many bubbles to display, QV will just simple ignore it. cmiiw
So to display as we want it, select some bubbles... and voila!