Unlock a world of possibilities! Login now and discover the exclusive benefits awaiting you.
- Qlik Community
- :
- Blogs
- :
- Technical
- :
- Design
- :
- The Calculation Engine
- Subscribe to RSS Feed
- Mark as New
- Mark as Read
- Bookmark
- Subscribe
- Printer Friendly Page
- Report Inappropriate Content
In a previous blog post, I wrote about Logical Inference and Aggregations, explaining that two different evaluation steps are executed every time you click in QlikView. This post will focus on the second evaluation step – The calculation of all objects.
This is The Calculation Engine.
The Calculation Engine (sometimes called the Chart Engine) is used in all places where you have aggregations. And since you have aggregations in almost every expression, the calculation engine can be invoked from any object: Usually it is invoked when calculating the measure in a chart, but it is also used for labels, for calculated colors, for text boxes, for show conditions, and for advanced search strings.
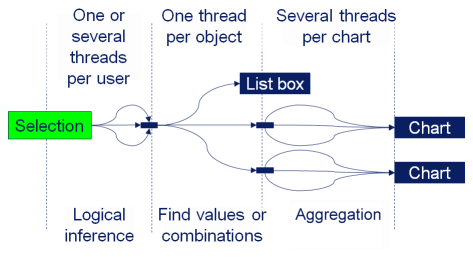
The calculation engine runs through two steps: First it finds combinations of the values of the fields used in the aggregation function, and, if necessary, builds a temporary look-up table. Then, it performs the actual aggregation using the look-up table to create all relevant combinations. If the aggregation is a measure in a chart or in an Aggr() function, the aggregation is made separately for every dimensional value, using the appropriate scopes.
- The Logical Inference
- The Calculation Engine (once for every object or aggregation)
- Find all combinations (create the necessary look-up tables)
- Aggregate
The different phases can be seen in the picture. The text “Chart” here represents any object with an aggregation, and the text “List box” represents a standard List box without aggregation.
Examples:
Sum( Amount )
In this case, the summation is made in the data table where the field Amount is found. Hence, “finding the combinations” is reduced to looking in this table.
Sum( NoOfUnits * UnitCost )
In this case, there are several fields inside the aggregation function. If the fields reside in different data tables, QlikView first generates the look-up table for UnitCost using the appropriate key, e.g. ProductID. Then it generates all combinations of the relevant field values using the look-up table – basically a join – and makes the summation on the fly.
Sum( NoOfUnits * UnitCost ) / Count( distinct OrderID )
The numerator is the same as before (and treated the same) but now there is an additional aggregation in the denominator. So, QlikView will need to generate a help table for this aggregation too, listing the distinct order IDs. For each dimensional value, two aggregations are made, whereupon the ratio between the two is calculated.
Sum( If( IsThisYear, Amount ))
Flags are often used inside aggregation functions, and usually this is not a problem. However, be aware that QlikView will create all combinations of the two fields before summing, and that this could in odd cases cause duplication of records.
The aggregation step is multi-threaded. However, finding the relevant combinations of field values is currently a single threaded operation, and may occasionally be the bottle-neck when calculating a chart. So be aware of this when you use fields from different tables in the same aggregation function. You might want to consider moving a field to the “correct” table to minimize the impact of this step.
PS. All of the above is of course true for both QlikView and Qlik Sense. Both use the same engine.
If you want to read more about QlikView internals, see also
Symbol Tables and Bit-Stuffed Pointers
Colors, states and state vectors
Logical Inference and Aggregations
It’s all Aggregations
You must be a registered user to add a comment. If you've already registered, sign in. Otherwise, register and sign in.