Unlock a world of possibilities! Login now and discover the exclusive benefits awaiting you.
- Subscribe to RSS Feed
- Mark as New
- Mark as Read
- Bookmark
- Subscribe
- Printer Friendly Page
- Report Inappropriate Content
In the QlikCommunity forum I have often seen people claim that you should minimize the number of hops in your Qlik data model in order to get the best performance.
I claim that this recommendation is not (always) correct.
In most cases, you do not need to minimize the number of hops since it affects performance only marginally. This post will try to explain when an additional table significantly will affect performance and when it will not.
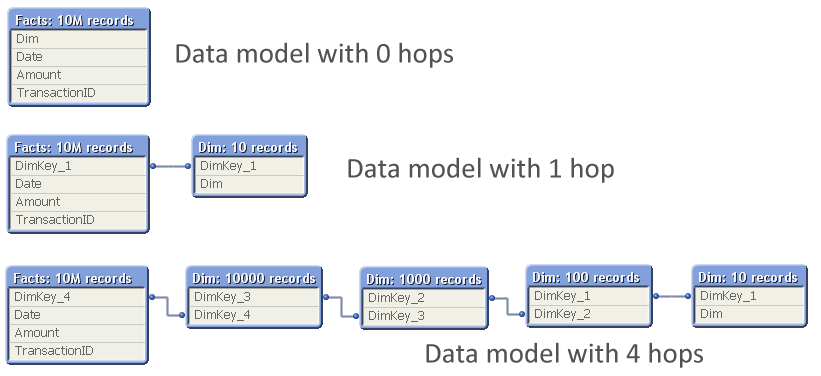
The problem is which data model to choose:

The question is: Should you normalize and have many tables, with several hops between the dimension table and the fact table? Or should you join the tables to remove hops?
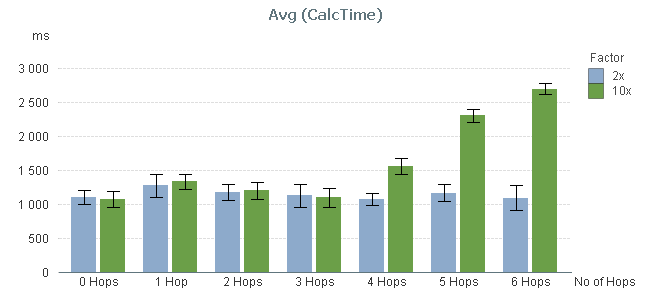
So, I ran a test where I measured the calculation time of a pivot table calculating a simple sum in a large fact table and using a low-cardinality dimension, while varying the number of hops between the two. The graph below shows the result. I ran two series of tests, one where the cardinality of the dimensional tables changed with a factor 10 for each table; and one where it changed with a factor 2.

You can clearly see that the performance is not affected at all by the number of hops – at least not between 0 and 3 hops.
By 4 hops, the calculation time in the 10x series however starts to increase slightly and by 5 hops it has increased a lot. But this is not due to the number of hops. Instead, it is the result of the primary dimension table (the dim table closest to the fact table) getting large: By 5 hops it has 100.000 records and can no longer be regarded as a small table.
To show this, I made a second test: I measured the calculation time of the same pivot table using a fix 3-table data model, varying the number of records in the intermediate table, but keeping the sizes of the other tables.

In real life, this structure would correspond to a part of a more complex data model, e.g.
- Facts - Products - Product Groups
- Order Lines - Order Headers - Customers
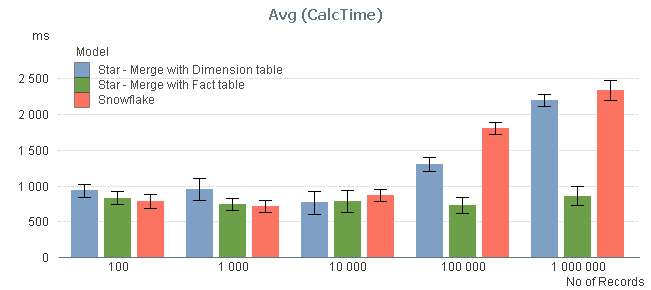
The result of my measurement can be seen in the red bars below:

The graph confirms that the size of the intermediate table is a sensitive point: If it has 10.000 records or less, its existence hardly affects performance. But if it is larger, you get a performance hit.
I also measured the calculation times after joining the intermediate table, first to the left with the fact table, and then to the right with the dimension table, to see if the calculation times decreased (blue and green bars). You can see that joining tables with 10.000 records or less, does not change the performance. But if you have larger tables, a join with the fact table may be a good idea.
Conclusions:
- The number of hops does not always cause significant performance problems in the chart calculation. But a large intermediate table will.
- If you have both a primary and a secondary dimension (e.g. Products and Product Groups), you should probably not join them. Leave the data model as a snowflake.
- If you have the facts in two large tables (e.g. Order Lines and Order Headers), you should probably join them into one common transaction table.
PS. A couple of disclaimers:
- The above study only concerns the chart calculation time - which usually is the main part of the response time.
- If the expression inside your aggregation function contains fields from different tables, none of the above is true.
- Your data is different than mine. You may get slightly different results.
Further reading related to this topic:
- « Previous
-
- 1
- 2
- 3
- 4
- Next »
You must be a registered user to add a comment. If you've already registered, sign in. Otherwise, register and sign in.