Unlock a world of possibilities! Login now and discover the exclusive benefits awaiting you.
- Qlik Community
- :
- All Forums
- :
- QlikView App Dev
- :
- how to write this expression
- Subscribe to RSS Feed
- Mark Topic as New
- Mark Topic as Read
- Float this Topic for Current User
- Bookmark
- Subscribe
- Mute
- Printer Friendly Page
- Mark as New
- Bookmark
- Subscribe
- Mute
- Subscribe to RSS Feed
- Permalink
- Report Inappropriate Content
how to write this expression
Hello All,
if i got table like below
suppiler code date
a A 01/01/2015
b A 12/03/2015
c B 02/01/2015
d A+ 2 0/03/2016
a A+ 31/03/2016
b B 31/03/2016
c C 31/03/2016
d A+ 31/03/2016
e A+ 31/03/2016
so what i am looking is :in a pie chart i need to show count of each code based up on there suppliers latest date
i mean output: in a pie chart :dimension= code
expression:?(what shou;d i need to write)
result table: code count(supplier)
A 0 (supplier 'a' latest score is A+)
A+ 3
B 1
C 1
thanks
naveen
- « Previous Replies
-
- 1
- 2
- Next Replies »
- Mark as New
- Bookmark
- Subscribe
- Mute
- Subscribe to RSS Feed
- Permalink
- Report Inappropriate Content
= count(Max(Date)
- Mark as New
- Bookmark
- Subscribe
- Mute
- Subscribe to RSS Feed
- Permalink
- Report Inappropriate Content
=count(Max(Distinct Date),Supplier))
- Mark as New
- Bookmark
- Subscribe
- Mute
- Subscribe to RSS Feed
- Permalink
- Report Inappropriate Content
This?
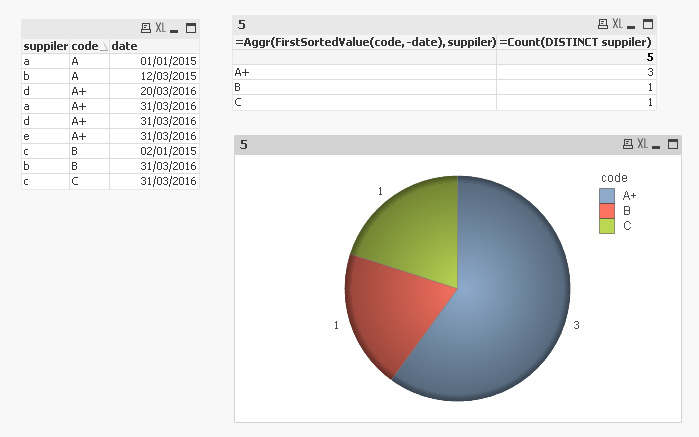
Dimension: =Aggr(FirstSortedValue(code, -date), suppiler)
Expression: =Count(DISTINCT supplier)
- Mark as New
- Bookmark
- Subscribe
- Mute
- Subscribe to RSS Feed
- Permalink
- Report Inappropriate Content
Hi!
dimension: code
expression: count({<date={"$(=date(max({1} date)))"}>}suppiler)
- Mark as New
- Bookmark
- Subscribe
- Mute
- Subscribe to RSS Feed
- Permalink
- Report Inappropriate Content
Hello
its not working in my case ,can you suggest anything diff
- Mark as New
- Bookmark
- Subscribe
- Mute
- Subscribe to RSS Feed
- Permalink
- Report Inappropriate Content
can you share your example or post some features of your script or app
- Mark as New
- Bookmark
- Subscribe
- Mute
- Subscribe to RSS Feed
- Permalink
- Report Inappropriate Content
What isn't working? Can you share your case because I have no idea why this isn't working for you 
- Mark as New
- Bookmark
- Subscribe
- Mute
- Subscribe to RSS Feed
- Permalink
- Report Inappropriate Content
A small change in my requirement
suppiler code date role
a A 01/01/2015 eval
a A+ 01/01/2015 self
b A 12/03/2015 eval
b A 12/03/2015 self
a A+ 31/03/2016 eval
a A+ 31/03/2016 self
b B 31/03/2016 eval
b B+ 31/03/2016 self
so what i am looking is :in a pie chart i need to show count of each code based up on there suppliers latest date and whose role is eval only
o/p:
suppiler count(code)
a 1(A+)
b 1 (B)
Dimension: =Aggr(FirstSortedValue(code, -date), suppiler)
Expression: =Count(DISTINCT supplier)
how to add role={'eval'} in the above expression ...
please
- Mark as New
- Bookmark
- Subscribe
- Mute
- Subscribe to RSS Feed
- Permalink
- Report Inappropriate Content
May be this:
Dimension: =Aggr(FirstSortedValue(role={'eval'} code, -date), suppiler)
Expression: =Count(role={'eval'} DISTINCT supplier)
Dimension: =Aggr(FirstSortedValue({<role={'eval'}>} code, -date), suppiler)
Expression: =Count({<role={'eval'}>} DISTINCT supplier)
- « Previous Replies
-
- 1
- 2
- Next Replies »