Unlock a world of possibilities! Login now and discover the exclusive benefits awaiting you.
- Qlik Community
- :
- All Forums
- :
- QlikView
- :
- Re: Stacked Bar Chart Issue
- Subscribe to RSS Feed
- Mark Topic as New
- Mark Topic as Read
- Float this Topic for Current User
- Bookmark
- Subscribe
- Mute
- Printer Friendly Page
- Mark as New
- Bookmark
- Subscribe
- Mute
- Subscribe to RSS Feed
- Permalink
- Report Inappropriate Content
Stacked Bar Chart Issue
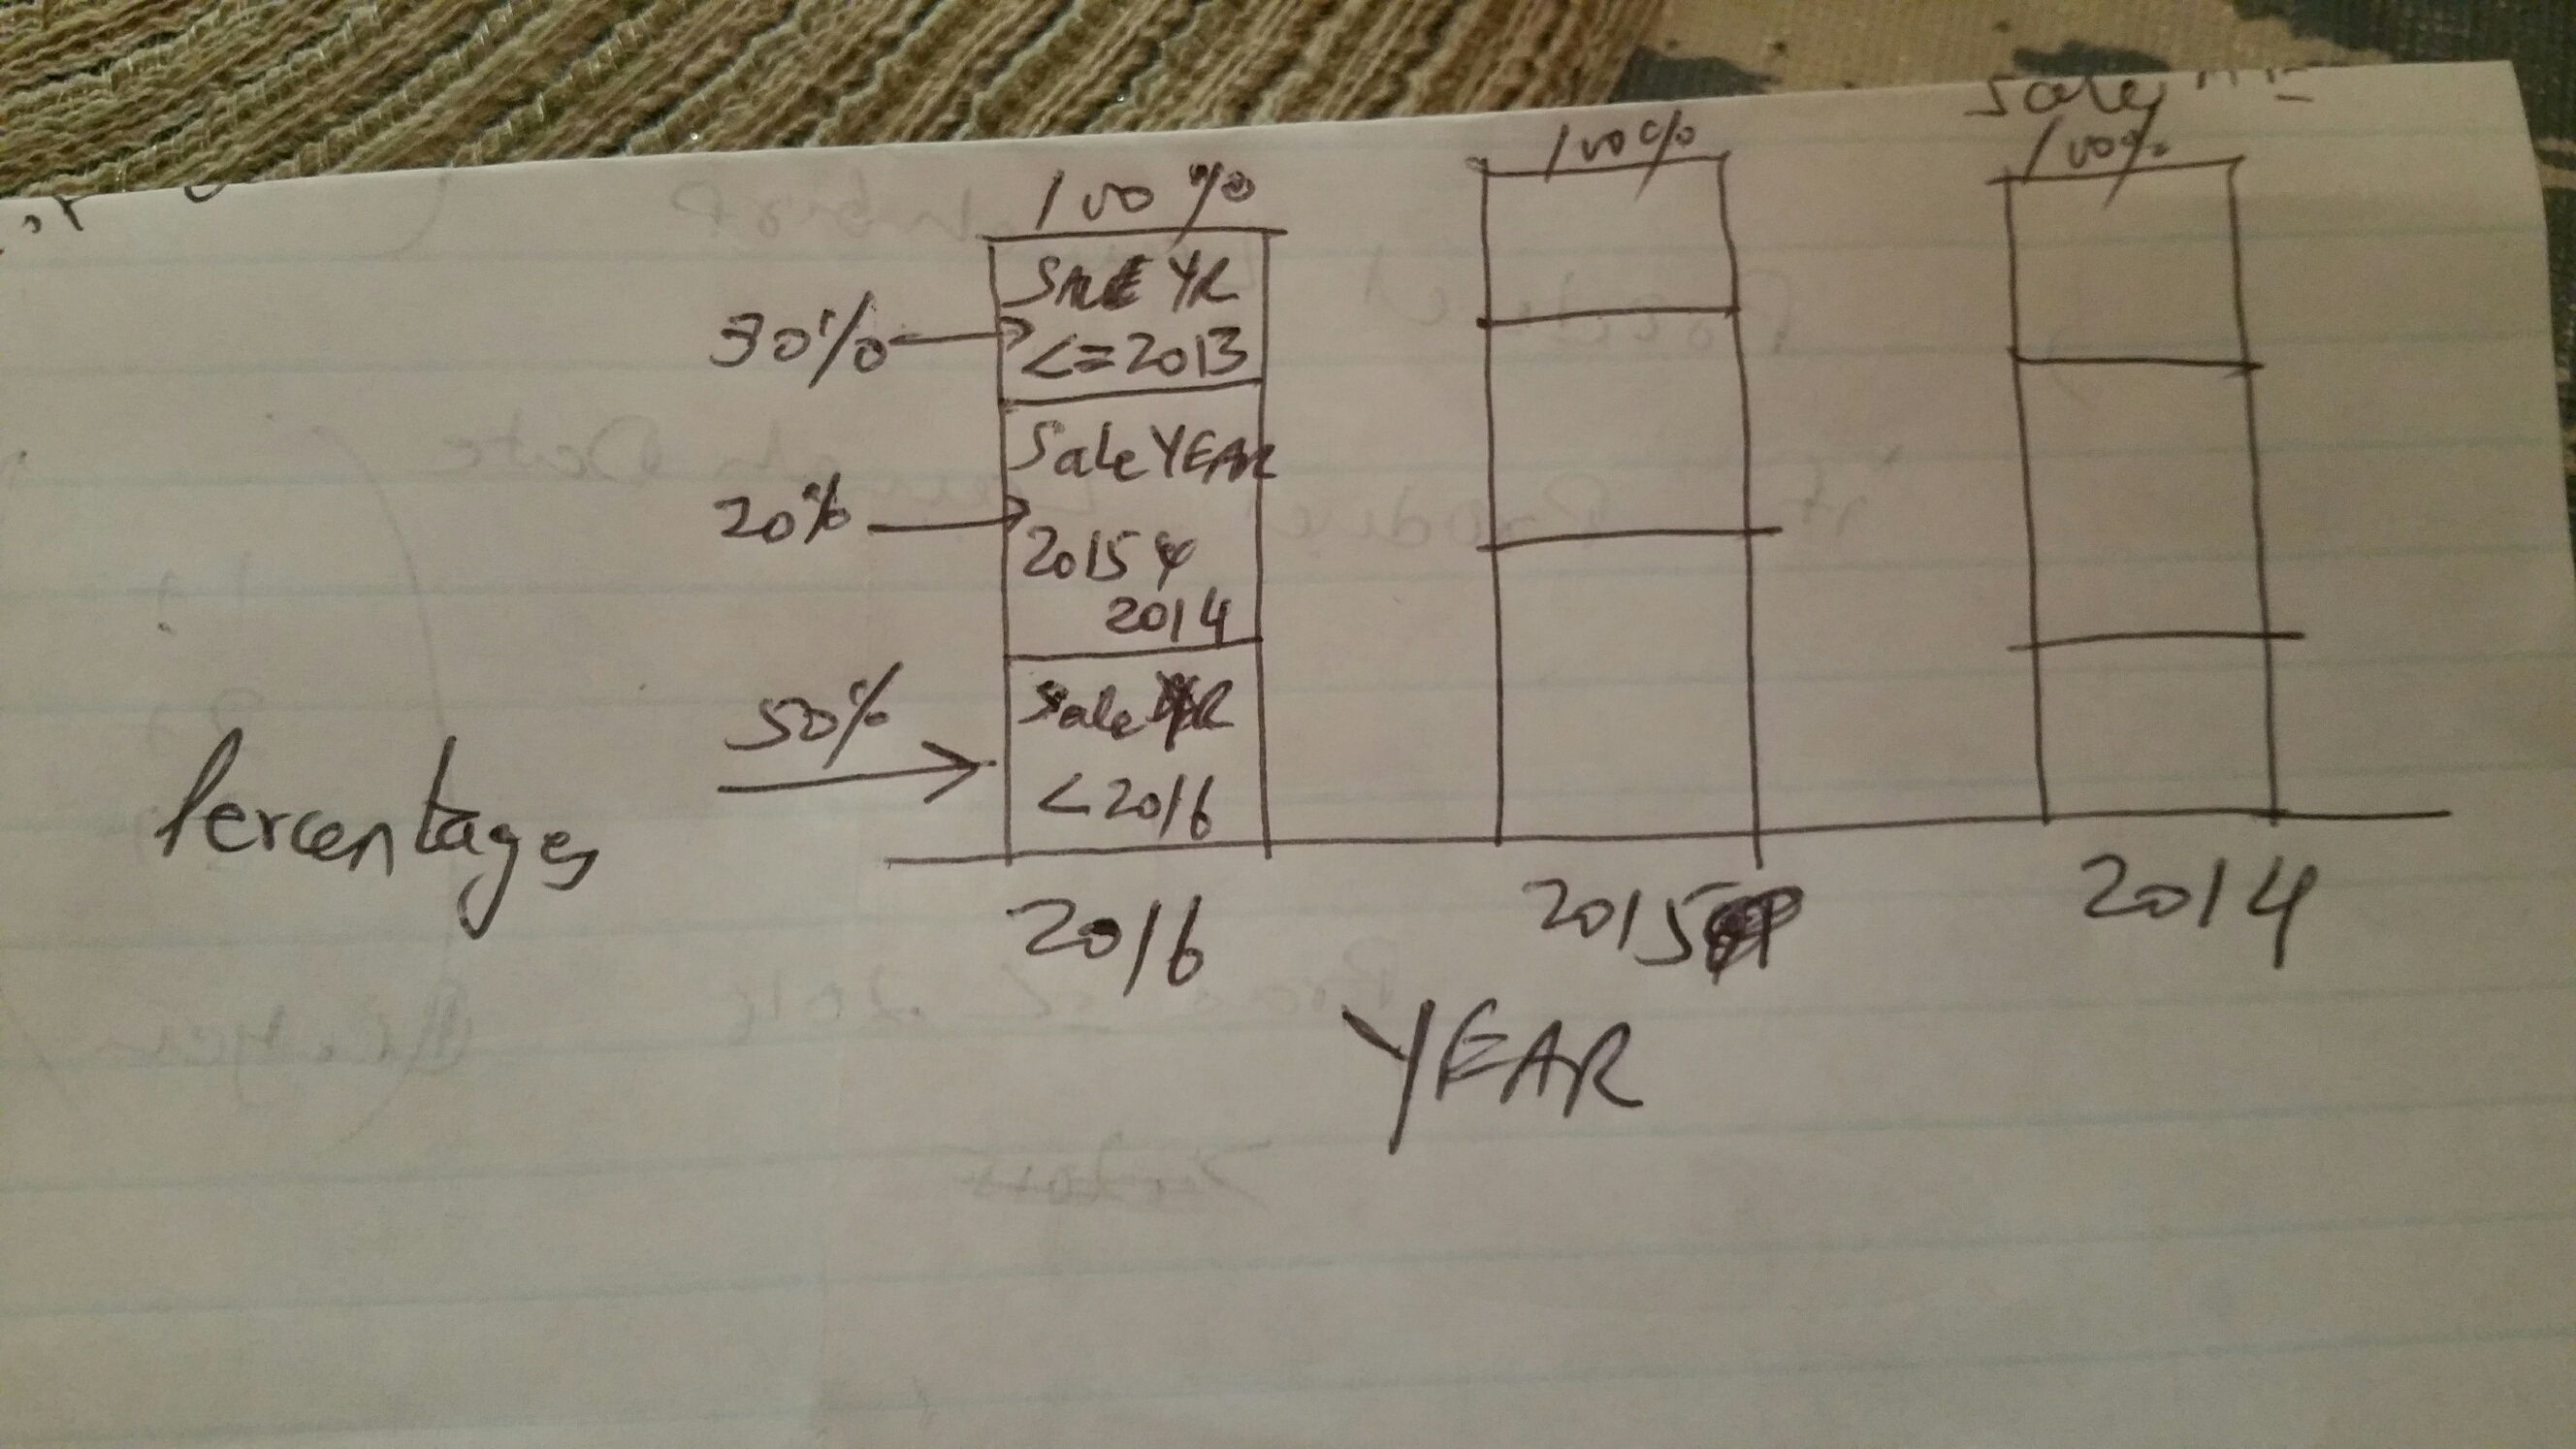
Attached is the sketch of the required bar chart. Along with the sample Excel file.
Looking for help in building this chart
- « Previous Replies
- Next Replies »
Accepted Solutions
- Mark as New
- Bookmark
- Subscribe
- Mute
- Subscribe to RSS Feed
- Permalink
- Report Inappropriate Content
no what I meant is lets say If I have another field called State and I want to use the same metrics for the filed of 'GA' for example
Something like
=Sum({<State={'GA'}>} Amount)
/
Sum({< State ={'GA'}> } TOTAL <Year> Amount)
its not working??
- Mark as New
- Bookmark
- Subscribe
- Mute
- Subscribe to RSS Feed
- Permalink
- Report Inappropriate Content
I guess create a new field from Sales Date. -> Year([Sales Date]) as [Sales Year]
And then use Year as your 1st dimension and Sales Year as second dimension
Expression:
Sum(Amount)/Sum(TOTAL <Year> Amount)
- Mark as New
- Bookmark
- Subscribe
- Mute
- Subscribe to RSS Feed
- Permalink
- Report Inappropriate Content
But if you look at the sketch I need to group the previous 2 years as one block and anything older then 3 yrs as a seperate block
- Mark as New
- Bookmark
- Subscribe
- Mute
- Subscribe to RSS Feed
- Permalink
- Report Inappropriate Content
May be create a flag in the script:
If(Year = Year([Sales Date]) or Year = Year([Sales Date]) + 1, Year([Sales Date]), Dual('<=' & (Year -2), (Year - 2))) as [Sales Year]
And then then same two dimensions and try the same expression
- Mark as New
- Bookmark
- Subscribe
- Mute
- Subscribe to RSS Feed
- Permalink
- Report Inappropriate Content
Can you please post a sample qvw
- Mark as New
- Bookmark
- Subscribe
- Mute
- Subscribe to RSS Feed
- Permalink
- Report Inappropriate Content
Like this:
- Mark as New
- Bookmark
- Subscribe
- Mute
- Subscribe to RSS Feed
- Permalink
- Report Inappropriate Content
Yes exactly. can you pls post the QVW?
- Mark as New
- Bookmark
- Subscribe
- Mute
- Subscribe to RSS Feed
- Permalink
- Report Inappropriate Content
I did add it to my response above. Open the link here ->Re: Stacked Bar Chart Issue
- Mark as New
- Bookmark
- Subscribe
- Mute
- Subscribe to RSS Feed
- Permalink
- Report Inappropriate Content
Got it, one last question. I am still not able to do the 3 stacks, so if Year is 2016 I would like to see
Stack 1 Sale Year = Year
Stack 2 Sale Year = Year-1 and Year -2
Stack 3 Sale Year <= Year -3
All 3 stacks should add up to 100%
- Mark as New
- Bookmark
- Subscribe
- Mute
- Subscribe to RSS Feed
- Permalink
- Report Inappropriate Content
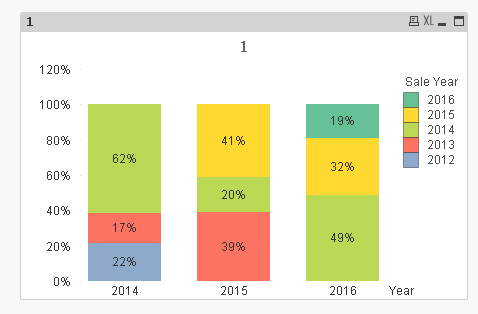
Above image is showing three stacks and they are adding up to 100%. Did you follow the similar logic in the script?
- « Previous Replies
- Next Replies »