Unlock a world of possibilities! Login now and discover the exclusive benefits awaiting you.
- Qlik Community
- :
- All Forums
- :
- QlikView App Dev
- :
- Re: how to make a chart like this
- Subscribe to RSS Feed
- Mark Topic as New
- Mark Topic as Read
- Float this Topic for Current User
- Bookmark
- Subscribe
- Mute
- Printer Friendly Page
- Mark as New
- Bookmark
- Subscribe
- Mute
- Subscribe to RSS Feed
- Permalink
- Report Inappropriate Content
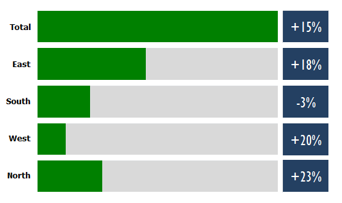
how to make a chart like this
Hi all:
I have a problem that I need a chart like below in qlikview with data in the attachment.
Could anyone help me to get it?
ps: maybe need drill down with field Area. ( like city ,etc )
- Mark as New
- Bookmark
- Subscribe
- Mute
- Subscribe to RSS Feed
- Permalink
- Report Inappropriate Content
Beautifully done 
Thanks for sharing Clever
- Mark as New
- Bookmark
- Subscribe
- Mute
- Subscribe to RSS Feed
- Permalink
- Report Inappropriate Content
It´s an honor receive a compliment of you, Sunny
- Mark as New
- Bookmark
- Subscribe
- Mute
- Subscribe to RSS Feed
- Permalink
- Report Inappropriate Content
PFA
- Mark as New
- Bookmark
- Subscribe
- Mute
- Subscribe to RSS Feed
- Permalink
- Report Inappropriate Content
Your Only( [2014 Score]) is returning null
Maybe you can try:
dual(Concat(DISTINCT [2014 Score]),2)
- Mark as New
- Bookmark
- Subscribe
- Mute
- Subscribe to RSS Feed
- Permalink
- Report Inappropriate Content
Of course it depends on what you that be show at right block
- Mark as New
- Bookmark
- Subscribe
- Mute
- Subscribe to RSS Feed
- Permalink
- Report Inappropriate Content
Clever, Values are not coming, Why? Can you please help me on this
- Mark as New
- Bookmark
- Subscribe
- Mute
- Subscribe to RSS Feed
- Permalink
- Report Inappropriate Content
Clever -
Honor is all mine to be in the company of elites such as yours.
Best,
Sunny
- Mark as New
- Bookmark
- Subscribe
- Mute
- Subscribe to RSS Feed
- Permalink
- Report Inappropriate Content
thank you, and I love your method,but could you display the exact value in the green region?
- Mark as New
- Bookmark
- Subscribe
- Mute
- Subscribe to RSS Feed
- Permalink
- Report Inappropriate Content
Hi,
Of course it would be easy to add the values as a separate column like this:
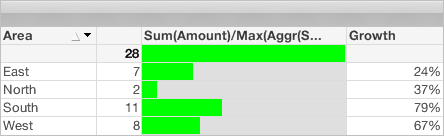
If you want the values to be appear on top of the bars it's a bit tricky but it can be done. Make a straight table like this with dimension Area but in the presentation tab hide the dimension column:
| Sum(Amount) |
|---|
| 7 |
| 2 |
| 11 |
| 8 |
In the properties style tab set the cell borders and background transparency to 100% and click the background button and set the color transparency to 100%.
Uncheck Show Caption and Suppress the Header Row in the presentation tab, so you should have a vertical list of the values with no other pixels around them.
To save confusion to a user make both straight tables read only. In properties set the layer of the table with the bars to bottom in the new table set the layer to top (Layout tab).
Now position the small table over the first.
It's a bit awkward - having the values as a separate column is a whole lot easier.
Good luck
Andrew
- Mark as New
- Bookmark
- Subscribe
- Mute
- Subscribe to RSS Feed
- Permalink
- Report Inappropriate Content
Hi,
Clever Anjos
thanks a lot, but if the value of Amount is enough large, Growth will not display normally, so could you solve the problem?