Unlock a world of possibilities! Login now and discover the exclusive benefits awaiting you.
Announcements
Save an extra $150 Dec 1–7 with code CYBERWEEK - stackable with early bird savings: Register
- Qlik Community
- :
- All Forums
- :
- QlikView App Dev
- :
- how to make a chart like this
Options
- Subscribe to RSS Feed
- Mark Topic as New
- Mark Topic as Read
- Float this Topic for Current User
- Bookmark
- Subscribe
- Mute
- Printer Friendly Page
Turn on suggestions
Auto-suggest helps you quickly narrow down your search results by suggesting possible matches as you type.
Showing results for
Not applicable
2016-08-02
05:23 AM
- Mark as New
- Bookmark
- Subscribe
- Mute
- Subscribe to RSS Feed
- Permalink
- Report Inappropriate Content
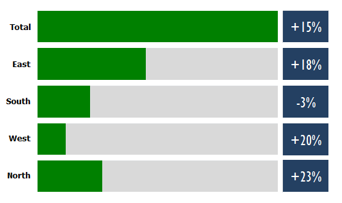
how to make a chart like this
Hi all:
I have a problem that I need a chart like below in qlikview with data in the attachment.
Could anyone help me to get it?
ps: maybe need drill down with field Area. ( like city ,etc )
- « Previous Replies
- Next Replies »
25 Replies
Employee
2016-08-03
11:10 AM
- Mark as New
- Bookmark
- Subscribe
- Mute
- Subscribe to RSS Feed
- Permalink
- Report Inappropriate Content
Your Only( [2014 Score]) is returning null
Maybe you can try:
dual(Concat(DISTINCT [2014 Score]),2)
598 Views
Employee
2016-08-03
11:11 AM
- Mark as New
- Bookmark
- Subscribe
- Mute
- Subscribe to RSS Feed
- Permalink
- Report Inappropriate Content
Could you attach a screenshot?
Not applicable
2016-08-03
10:02 PM
Author
- Mark as New
- Bookmark
- Subscribe
- Mute
- Subscribe to RSS Feed
- Permalink
- Report Inappropriate Content
so ,how about this?
598 Views
Not applicable
2016-08-04
06:33 AM
Author
- Mark as New
- Bookmark
- Subscribe
- Mute
- Subscribe to RSS Feed
- Permalink
- Report Inappropriate Content
Hi,
Andrew Walker,could you make it on the left ?
598 Views
Not applicable
2016-08-05
04:16 AM
Author
- Mark as New
- Bookmark
- Subscribe
- Mute
- Subscribe to RSS Feed
- Permalink
- Report Inappropriate Content
Can we do this grouped bar chart as well
598 Views
Employee
2016-08-05
07:45 AM
- Mark as New
- Bookmark
- Subscribe
- Mute
- Subscribe to RSS Feed
- Permalink
- Report Inappropriate Content
I was asking about a screenshot of your graph showing your issue
" if the value of Amount is enough large, Growth will not display normally, so could you solve the problem?"
- « Previous Replies
- Next Replies »