Unlock a world of possibilities! Login now and discover the exclusive benefits awaiting you.
- Qlik Community
- :
- All Forums
- :
- QlikView App Dev
- :
- Re: Pivot table - how to collapse subsections
- Subscribe to RSS Feed
- Mark Topic as New
- Mark Topic as Read
- Float this Topic for Current User
- Bookmark
- Subscribe
- Mute
- Printer Friendly Page
- Mark as New
- Bookmark
- Subscribe
- Mute
- Subscribe to RSS Feed
- Permalink
- Report Inappropriate Content
Pivot table - how to collapse subsections
Hi,
I have been looking at the settings of the pivot chart but just can't seem to find the right
property/setting for this or how to configure this. How do I collapse some of the dimensions of this sample screen?
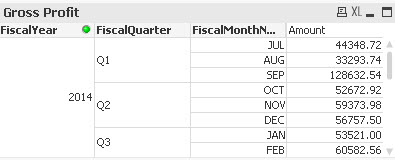
For example, I want to collapse the "FiscalQuarter" and show a "+" sign. When I click on the "+" sign, only then
expand the column to show all the possible quarters. Same thing for the month.
Thanks
- « Previous Replies
-
- 1
- 2
- Next Replies »
- Mark as New
- Bookmark
- Subscribe
- Mute
- Subscribe to RSS Feed
- Permalink
- Report Inappropriate Content
Hi,
Go to -> properties -> presentation tab and then make sure that "Always Fully Expanded" is unchecked:

Hope it helps.
- Mark as New
- Bookmark
- Subscribe
- Mute
- Subscribe to RSS Feed
- Permalink
- Report Inappropriate Content
Yes, I did look at that before. I wasn't being clear in my original post. Can you selectively pick the dimension
you want to collapse/expand on? Example, using my screenshot, can you do this on FiscalMonth column? Meaning when chart is initially displayed, can I have the "+" on FiscalQuarter column?
The "always fully expanded" is either all or nothing operation.
Thanks!
- Mark as New
- Bookmark
- Subscribe
- Mute
- Subscribe to RSS Feed
- Permalink
- Report Inappropriate Content
If you right click on any dimension heading and select expand/collapse, it does for all values for that dimension only. Once it is done it keeps that setting even when we close and reopen the doc, not sure how it behaves in server environment. But for local docs its keeps the setting after initial setting made on which DIM to be collapsed or expanded while preparing the chart.
- Mark as New
- Bookmark
- Subscribe
- Mute
- Subscribe to RSS Feed
- Permalink
- Report Inappropriate Content
Yes, I did notice this that QV seems to "remember" the last state. However the above screenshot is a very simple one with only one year. What if I have 2010, 2011 ... 2016? Obviously it will more rows for the Quarter. The more rows I have, the more combination of various states of the collapse/expand for the different dimensions. So, next time when you open it, it really doesn't look that pretty and it doesn't have that consistent "look & feel".
- Mark as New
- Bookmark
- Subscribe
- Mute
- Subscribe to RSS Feed
- Permalink
- Report Inappropriate Content
look and feel for pivot is either fully expanded or collapsed.. Not at intermediate states one expanded and one collapsed.
In QV, Document state can be remembered for user until application is next reloaded!!
- Mark as New
- Bookmark
- Subscribe
- Mute
- Subscribe to RSS Feed
- Permalink
- Report Inappropriate Content
OK, a slightly different question on the pivot chart. Currently I have four columns showing in my pivot chart.
I have manually expanded the width of this chart to show all 4 columns. No problem. But how I can expand the width slightly even wider so that it aligns with the width of another object above it? If I try it, QV won't let me go further.
- Mark as New
- Bookmark
- Subscribe
- Mute
- Subscribe to RSS Feed
- Permalink
- Report Inappropriate Content
Correction: actually it's not a pivot chart. I want to do it on a Table Box.
- Mark as New
- Bookmark
- Subscribe
- Mute
- Subscribe to RSS Feed
- Permalink
- Report Inappropriate Content
Check this out, solution using bookmark and macro-
Re: expand only one field value in a pivot table (on open action)
- Mark as New
- Bookmark
- Subscribe
- Mute
- Subscribe to RSS Feed
- Permalink
- Report Inappropriate Content
Did you try using coordinates at the bottom of 'caption'?
- « Previous Replies
-
- 1
- 2
- Next Replies »