Unlock a world of possibilities! Login now and discover the exclusive benefits awaiting you.
- Qlik Community
- :
- All Forums
- :
- QlikView App Dev
- :
- Combo Chart - Swap expressions and dimensions
- Subscribe to RSS Feed
- Mark Topic as New
- Mark Topic as Read
- Float this Topic for Current User
- Bookmark
- Subscribe
- Mute
- Printer Friendly Page
- Mark as New
- Bookmark
- Subscribe
- Mute
- Subscribe to RSS Feed
- Permalink
- Report Inappropriate Content
Combo Chart - Swap expressions and dimensions
Hello,
I have simple database with audits results:
| Country | Group | rest | KPI1 | KPI2 |
|---|---|---|---|---|
| Country1 | Group 1 | store1 | 1 | 2 |
| Country1 | Group 2 | store2 | 2 | 1 |
| Country1 | Group 1 | store3 | 3 | 3 |
| Country2 | Group 4 | store4 | 2 | 2 |
I'm trying to do Combo Chart with few information:
- Bars - Score per each store
- Line - Trend for group
- Line - Trend for country
We should be able to analyze only 1 country and 1 group at the same moment.
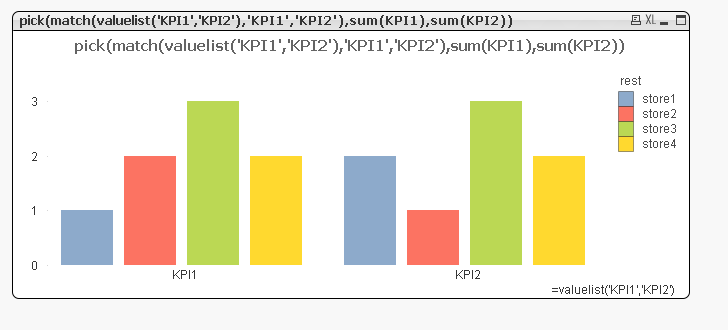
My problem is that I always have chart like below, so each restaurant and score.

I would like to get KPI category and each restaurant

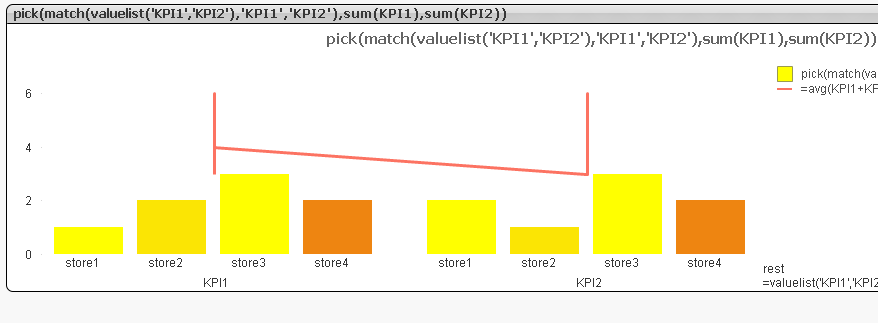
Next problem could be trend for Group and Country but as I think TOTAL will help me.
Do you have any ideas ?
Thanks,
Piotr
Accepted Solutions
- Mark as New
- Bookmark
- Subscribe
- Mute
- Subscribe to RSS Feed
- Permalink
- Report Inappropriate Content
- Mark as New
- Bookmark
- Subscribe
- Mute
- Subscribe to RSS Feed
- Permalink
- Report Inappropriate Content
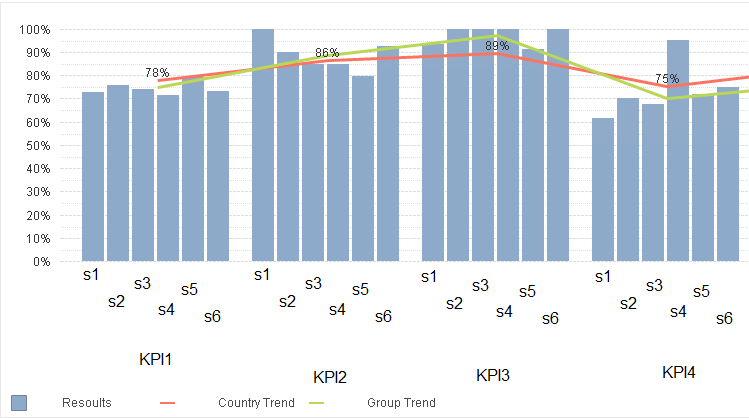
Hi,
Please see the attached which hopefully is what you want?
- Mark as New
- Bookmark
- Subscribe
- Mute
- Subscribe to RSS Feed
- Permalink
- Report Inappropriate Content
Thank you Adam for help.
I did also Country and Group Trend but together with next expression I lost colors. Do you know how maybe we can add colors per each store ? Number of store in group could be from 1 to n.
Regards
Piotr
- Mark as New
- Bookmark
- Subscribe
- Mute
- Subscribe to RSS Feed
- Permalink
- Report Inappropriate Content
can you add a qvw for me to tinker with?
- Mark as New
- Bookmark
- Subscribe
- Mute
- Subscribe to RSS Feed
- Permalink
- Report Inappropriate Content
Ok so you can use the colourmixtool to do this, exclude my rubbish example!
Code I used for the background colour was:
ColorMix1 ((1+Sign(2*(keepchar(Group,'0123456789')-RangeMin (top(total keepchar(Group,'0123456789'),1,NoOfRows(total))))/(RangeMax (top(total keepchar(Group,'0123456789'),1,NoOfRows(total)))-RangeMin (top(total keepchar(Group,'0123456789'),1,NoOfRows(total))))-1)*Sqrt(Fabs((2*(keepchar(Group,'0123456789')-RangeMin (top(total keepchar(Group,'0123456789'),1,NoOfRows(total))))/(RangeMax (top(total keepchar(Group,'0123456789'),1,NoOfRows(total)))-RangeMin (top(total keepchar(Group,'0123456789'),1,NoOfRows(total))))-1))))/2, ARGB(255, 255, 255, 0), ARGB(255, 238, 133, 17))
- Mark as New
- Bookmark
- Subscribe
- Mute
- Subscribe to RSS Feed
- Permalink
- Report Inappropriate Content
I'm sorry but I don't understand your function 😕 Could you please explain what are you doing or what I should put into Colormix Wizard ?
I tried use your code in my app but without any resoult. Only one parameterer which I change was "Group" to my standard. BTW, why we have there "Group" instead of "Rest" ?? On chart we mark rests.
- Mark as New
- Bookmark
- Subscribe
- Mute
- Subscribe to RSS Feed
- Permalink
- Report Inappropriate Content
As I said it was purely an example on my own rubbish data so it will need translating, with a qvw with your fields I could create the formula you require.
Basically when you go in to the 'background colour' formula editor on your chart, you can choose file > colourmix
What you then need is something consistent for your 'rest' (which is your store?) which will mean that the colours for each item will be the same across the measures.
So, as your stores are simply numbered then we can strip out the 'S' leaving a unique number for the store which is why we are using keepchar(Group,'0123456789')
So S1 will always be 1, S19 19 etc
Then the colourmix wizard will just assign colours based on the number, but it will be the same for each measure group
I hope that makes sense?
- Mark as New
- Bookmark
- Subscribe
- Mute
- Subscribe to RSS Feed
- Permalink
- Report Inappropriate Content
I found where I did mistake. I used store name instead of store number. I have two separate columns for that and I don't know why but with names it doesn't work. I change it to store number and it's fine.
Thank you again for help.