Unlock a world of possibilities! Login now and discover the exclusive benefits awaiting you.
- Qlik Community
- :
- All Forums
- :
- QlikView App Dev
- :
- Re: Set Analysis with a varied Date according to e...
- Subscribe to RSS Feed
- Mark Topic as New
- Mark Topic as Read
- Float this Topic for Current User
- Bookmark
- Subscribe
- Mute
- Printer Friendly Page
- Mark as New
- Bookmark
- Subscribe
- Mute
- Subscribe to RSS Feed
- Permalink
- Report Inappropriate Content
Set Analysis with a varied Date according to each dimension
Hi,
My data source is a flat table with the following fields:
EmployeeName
TrainingDate: Date that the employee received training, under the format: dd-MMM-yy
ReportingMonth: Last day of the month, under the format: MMM-yyyy
CarSold: Number of cars sold within that month
...(other fields irrelevant to this question)
Flat table looks somewhat like this:
| ReportingMonth | EmployeeName | CarSold | TrainingDate | other irrelevant fields |
|---|---|---|---|---|
| Dec-2016 | A | 6 | 11-Jun-15 | |
| Dec-2016 | B | 8 | 25-Sep-16 | |
| Dec-2016 | C | 7 | 5-Dec-16 | |
| Dec-2016 | D | 8 | 30-Aug-16 | |
| Dec-2016 | E | 6 | 8-Oct-15 | |
| Nov-2016 | A | 3 | 11-Jun-15 | |
| Nov-2016 | B | 2 | 25-Sep-16 | |
| Nov-2016 | C | 4 | 5-Dec-16 | |
| Nov-2016 | D | 3 | 30-Aug-16 | |
| Nov-2016 | E | 2 | 8-Oct-15 |
I want to create a table in QlikSense that show the total number of car sold by each Employee during the month of his/her training. So far my table is like this:
| EmployeeName | TrainingDate | Training Month | Car Sold in Training Month |
|---|---|---|---|
| A | 11-Jun-15 | Jun-2015 | ... |
| B | 25-Sep-16 | Sep-2016 | ... |
| C | 5-Dec-16 | Dec-2016 | ... |
| D | 30-Aug-16 | Aug-2016 | ... |
| E | 8-Oct-15 | Oct-2015 | ... |
Formula for each column:
Dimension: =EmployeeName
Measure 1: =TrainingDate
Measure 2: =Date(TrainingDate,'MMM-yyyy')
Measure 3: =sum({<[Other Fields] = {'Other Field values'}, ReportingMonth = {'$(=Date(TrainingDate,'MMM-yyyy'))'}>} CarSold)
I could not get the Measure 3 column to work. How should I write this formula differently?
If this is too much for set analysis, I probably can get rid of the Date(...) formula by changing the format of the TrainingDate to match the ReportingMonth right from the loading script. I'm more concerned of how to get the ReportingMonth to vary with the Dimension.
Thanks a lot! Please let me know if you have any question.
- « Previous Replies
-
- 1
- 2
- Next Replies »
- Mark as New
- Bookmark
- Subscribe
- Mute
- Subscribe to RSS Feed
- Permalink
- Report Inappropriate Content
Hi
set analysis won't work in this case because set analysis is like making a selection in the model
it isn't evaluated by row basis
may be you can try
=sum({<[Other Fields] = {'Other Field values'}>} if(monthstart(ReportingMonth) =monthstart(TrainingDate), CarSold))
- Mark as New
- Bookmark
- Subscribe
- Mute
- Subscribe to RSS Feed
- Permalink
- Report Inappropriate Content
Both set analysis and a dollar sign expansion will be evaluated only once per chart, not per dimension line.
See for further information and a possible workaround (but this essentially uses an aggregation function per dimension line) in
- Mark as New
- Bookmark
- Subscribe
- Mute
- Subscribe to RSS Feed
- Permalink
- Report Inappropriate Content
You don't need to use Set Analysis for this table at all:
![2017-01-11 22_33_53-Edit Script [C__Users_psd_Downloads_Varied Date.qvw_].png](/legacyfs/online/149169_2017-01-11 22_33_53-Edit Script [C__Users_psd_Downloads_Varied Date.qvw_].png)
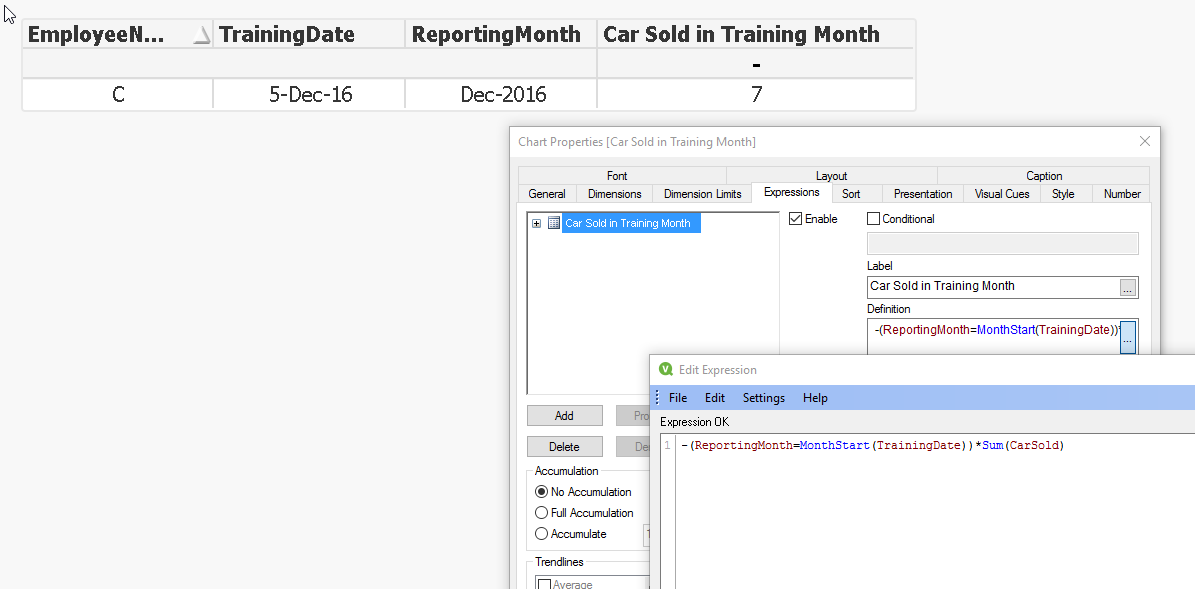
(ReportingMonth=MonthStart(TrainingDate)) returns 0 or -1 for false and true. So inverting the sign and multiplying with the Sum(CarSold) will give a sum different for zero for each employee that sold one or more cars in their training month.
In the load script you have to make the ReportingMonth into a real date which we select as the first day of the month. Thats why we use the MonthStart() function in the comparison too.
- Mark as New
- Bookmark
- Subscribe
- Mute
- Subscribe to RSS Feed
- Permalink
- Report Inappropriate Content
Thanks for the reply. But it doesn't work. Values only show if the TrainingDate is within the most recent ReportingMonth, I.e Dec 2016. Outside that, the formula returns 0
- Mark as New
- Bookmark
- Subscribe
- Mute
- Subscribe to RSS Feed
- Permalink
- Report Inappropriate Content
Thank you for the reply. But it seems to only return the employee's car sold in the month of the latest reporting month. Like from your screenshot, I only see Employee C, whose training was in Dec-2016, which happens to be our last reporting month.
Nonetheless, your suggestion gave me an idea, which is kind of working for the short-term.
if(MonthStart(TrainingDate)=MonthStart(ReportingMonth),'1','0')
* sum({<[other fields]={'other values'}>} CarSold)
+
if(MonthStart(TrainingDate)=MonthStart(ReportingMonth,-1),'1','0')
* sum({<[other fields]={'other values'}, ReportingMonth={'$(=MonthStart(ReportingMonth,-1))'} >} CarSold)
+
if(MonthStart(TrainingDate)=MonthStart(ReportingMonth,-2),'1','0')
* sum({<[other fields]={'other values'}, ReportingMonth={'$(=MonthStart(ReportingMonth,-2))'} >} CarSold)
+ ...
All colored chunk will equal 0, except for 1 chunk, for each of the employee. That is when TrainingDate of that employee falls into the right month in the Set Analysis on the 2nd line of each chunk.
I currently have 20 months of data, so this formula will have 20 chunks for now. Not a hard task since we only have to change 2 numbers for each chunk. That's why I say this is working for the short-term only.
A long-term fix I'm thinking of, is having a variable for this whole formula and put all variables in excel. I guess in Excel, it will be simpler to automatically add a colored chunk for each new month (via VBA?). Then, load the excel file in as a source for variables.
Do you have any suggestion to improve this formula?
- Mark as New
- Bookmark
- Subscribe
- Mute
- Subscribe to RSS Feed
- Permalink
- Report Inappropriate Content
Thanks a lot for the reply. I skimmed through your post and don't think my problem is worth such a sophisticated fix.
However, Petter's reply gave me an idea, which works in the short-term. It would be great if you can have a look. Thanks!
- Mark as New
- Bookmark
- Subscribe
- Mute
- Subscribe to RSS Feed
- Permalink
- Report Inappropriate Content
How about a new field?
if(ReportingMonth=monthstart(TrainingDate),'Y','N') as [Training Month?],
sum({<[Training Month?]={'Y'}>} CarSold)
Or even:
if(ReportingMonth=monthstart(TrainingDate),CarSold) as [Cars Sold in Training Month],
sum([Cars Sold in Training Month])
I would expect these to have the same problem as Liron's and Petter's solutions, which is something we need to diagnose. There's clearly something else going on in your real application that none of us understood. But what you don't want to do is code the monster of an expression that you show here. This is a simple problem with simple solutions. There's some very basic thing wrong with or misunderstood about your application if our solutions aren't working for you.
- Mark as New
- Bookmark
- Subscribe
- Mute
- Subscribe to RSS Feed
- Permalink
- Report Inappropriate Content
This is embarassing but you are right, John. Liron's solution actually work, although there is 1 small issue that still needed to get fix.
I forgot to mention/realize that I have a current selection of ReportingMonth='Dec-2016'. When I use Liron's formula and deselect the current selection, it gives me the values that I wanted.
However, I need to keep the current selection for other graphs/tables. Is there a way to ignore the current selection in the formula?:
=sum({<[Other Fields] = {'Other Field values'}>} if(monthstart(ReportingMonth) =monthstart(TrainingDate), CarSold))
I try adding "1", like: =sum({1<[Other Fields] = {'O..., but it ends up summing all the months data for Employee who trained in Dec-2016, while returning 0 for all other Employees.
Thanks again for all your help!
- Mark as New
- Bookmark
- Subscribe
- Mute
- Subscribe to RSS Feed
- Permalink
- Report Inappropriate Content
To ignore selections in a field, just list the field in the set analysis without giving it any values. So to add it to Liron's answer, for instance:
=sum({<[Other Fields] = {'Other Field values'},ReportingMonth>} if(monthstart(ReportingMonth) =monthstart(TrainingDate), CarSold))
Or in mine:
sum({<[Training Month?]={'Y'},ReportingMonth>} CarSold)
Or:
sum({<ReportingMonth>} [Cars Sold in Training Month])
If there's also a ReportingDate, ReportingYear, ReportingWeek, and so on, you might need to list them all.
But I'm concerned that adding 1 still returned 0. It sounds like there might be something in your other fields and other field values in the set analysis that might indirectly be excluding months other than December as well.
- « Previous Replies
-
- 1
- 2
- Next Replies »