Unlock a world of possibilities! Login now and discover the exclusive benefits awaiting you.
- Qlik Community
- :
- All Forums
- :
- QlikView App Dev
- :
- Re: After combine chart 1 and 2 into one chart i c...
- Subscribe to RSS Feed
- Mark Topic as New
- Mark Topic as Read
- Float this Topic for Current User
- Bookmark
- Subscribe
- Mute
- Printer Friendly Page
- Mark as New
- Bookmark
- Subscribe
- Mute
- Subscribe to RSS Feed
- Permalink
- Report Inappropriate Content
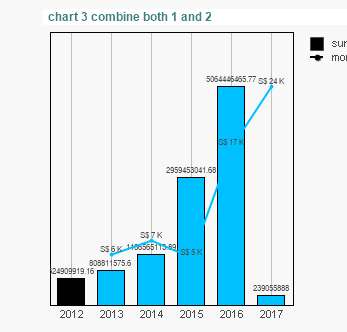
After combine chart 1 and 2 into one chart i can only see chart 2 bar.
Hi All
I have :-
Chart 1 a line chart YOY
Chart 2 a sales by year
When i combine both chart into 1.
I am unable to see the line chart YOY i can only see the Bar chart sales by year,
Paul
- Tags:
- qlikview_scripting
Accepted Solutions
- Mark as New
- Bookmark
- Subscribe
- Mute
- Subscribe to RSS Feed
- Permalink
- Report Inappropriate Content
on the expression tab, expand the expression and under Background colour just type in red() or lightred()
Please remember to mark this as helpful or the correct answer if I have helped you or answered your question.
This will help users identify the answers should they come across this thread in the future.
- Mark as New
- Bookmark
- Subscribe
- Mute
- Subscribe to RSS Feed
- Permalink
- Report Inappropriate Content
My QVW
- Mark as New
- Bookmark
- Subscribe
- Mute
- Subscribe to RSS Feed
- Permalink
- Report Inappropriate Content
Hi Paul,
Change the axes of one of your expressions to be left
- Mark as New
- Bookmark
- Subscribe
- Mute
- Subscribe to RSS Feed
- Permalink
- Report Inappropriate Content
Hi Sir
Thank you very it work.
Paul Yeo
DIrector
TDS Technology (S) P/L
Whatsapp +65 9326 1804
www.tdstech.com<http://www.tdstech.com>
- Mark as New
- Bookmark
- Subscribe
- Mute
- Subscribe to RSS Feed
- Permalink
- Report Inappropriate Content
Hi Adam
May i know how to make the line color to red color , ( now line and bar color are same ) .
Paul
- Mark as New
- Bookmark
- Subscribe
- Mute
- Subscribe to RSS Feed
- Permalink
- Report Inappropriate Content
on the expression tab, expand the expression and under Background colour just type in red() or lightred()
Please remember to mark this as helpful or the correct answer if I have helped you or answered your question.
This will help users identify the answers should they come across this thread in the future.
- Mark as New
- Bookmark
- Subscribe
- Mute
- Subscribe to RSS Feed
- Permalink
- Report Inappropriate Content
Hi Adam
Thank you it work fine now.
Paul
- Mark as New
- Bookmark
- Subscribe
- Mute
- Subscribe to RSS Feed
- Permalink
- Report Inappropriate Content
Hi All
May i know how to make the legend for Total Sales square box shown Red color ?
How to make the Left Y Axis display word Total sales ? and Right side Y Axis display YOY ?
Paul Yeo