Unlock a world of possibilities! Login now and discover the exclusive benefits awaiting you.
- Qlik Community
- :
- All Forums
- :
- QlikView App Dev
- :
- Re: Date and Percentage in PivotTable
- Subscribe to RSS Feed
- Mark Topic as New
- Mark Topic as Read
- Float this Topic for Current User
- Bookmark
- Subscribe
- Mute
- Printer Friendly Page
- Mark as New
- Bookmark
- Subscribe
- Mute
- Subscribe to RSS Feed
- Permalink
- Report Inappropriate Content
Date and Percentage in PivotTable
Good afternoon,
I need your help to solve this app in QlikView.
The application template is a bit confusing, so if you have any suggestions, you are welcome.
I also don't know if it is possible to do in this way I need.
I load the data with the following script: (It is in portuguese, so I wont translate the fields to you understand my expressions)
BaseCard:
LOAD
DATAINCLUSAO, //here shows the full date when the card was created
Month(DATAINCLUSAO) as MêsInclusão,
Year(DATAINCLUSAO) as AnoInclusão,
Monthname(MonthStart(DATAINCLUSAO)) as [Mês Ano],
SITUACAO, //here is as A(Active),B(Block) e C(canceled)
DATASITUACAO, //here shows the date when the situation changed
DATABLOQUEIO, //here shows the block date of the card
SITUACAOANTERIOR, // here shows the last situation
DATASITUACAOANTERIOR, // here shows the date of the last situation
FROM
In a PivotTable, I want to know the month / year of the situation, the quantity that was made, qty after 3 months, 6 and 12 months, and the %.
I used the following as a dimension:
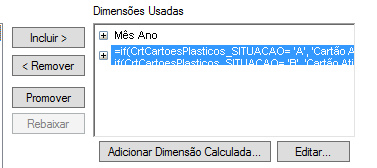
The calculated dimension is an 'if' to show the name of the situation.
In the expressions, I used the following:
For %:
count (SITUACAO) / Count (total (SITUACAO))
Qty:
count ([Year Month])
The way I'm doing both% and qty do not show the values I want.
The amount I want shows the value of cards for your situation (active, block, canc), for the month that was effectived.
For example: I can have a card that its inclusion date was 09/20/2016 but it was only unlocked on 12/20/2016, so I want it to count as produced in the month / year of inclusion (Sep / 2016) and appears as blocked. When I look at it after 3 months, I will see the same amount of cards made, but only your situation will change.
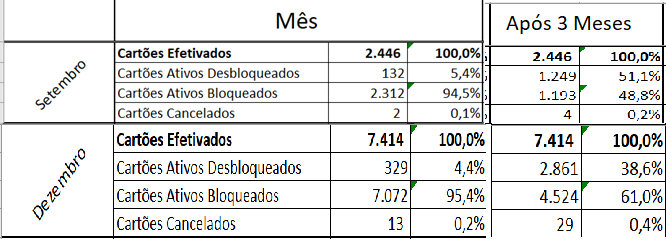
Note that the data after 3 months for sep, would be dec 2016. There it shows the cards that had as inclusion date the month of September, but were only unlocked in December.
The second line (December) also shows December 2016, but it shows only the cards that had as inclusion date from Dec / 2016 and were unblocked, or canceled in the month, after 3 months, etc ...
I want my application to look like the excel above, but I could only achieve this:
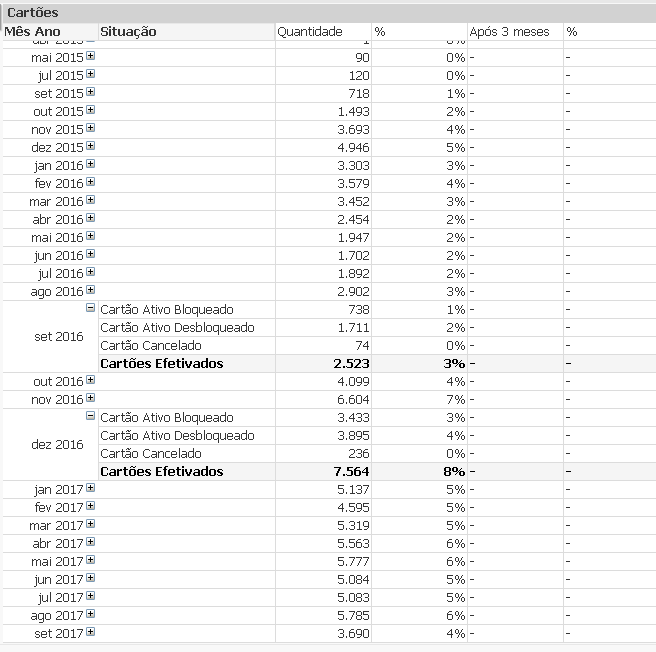
What should I do to get the model I need?
- « Previous Replies
-
- 1
- 2
- Next Replies »
- Mark as New
- Bookmark
- Subscribe
- Mute
- Subscribe to RSS Feed
- Permalink
- Report Inappropriate Content
Is Situacao a calculated dimension? Can you perform it in the script?
- Mark as New
- Bookmark
- Subscribe
- Mute
- Subscribe to RSS Feed
- Permalink
- Report Inappropriate Content
I am attaching an Excel for you (exported from your app) where I have pointed out current calculation and I want you to point me out what the expected calculation is
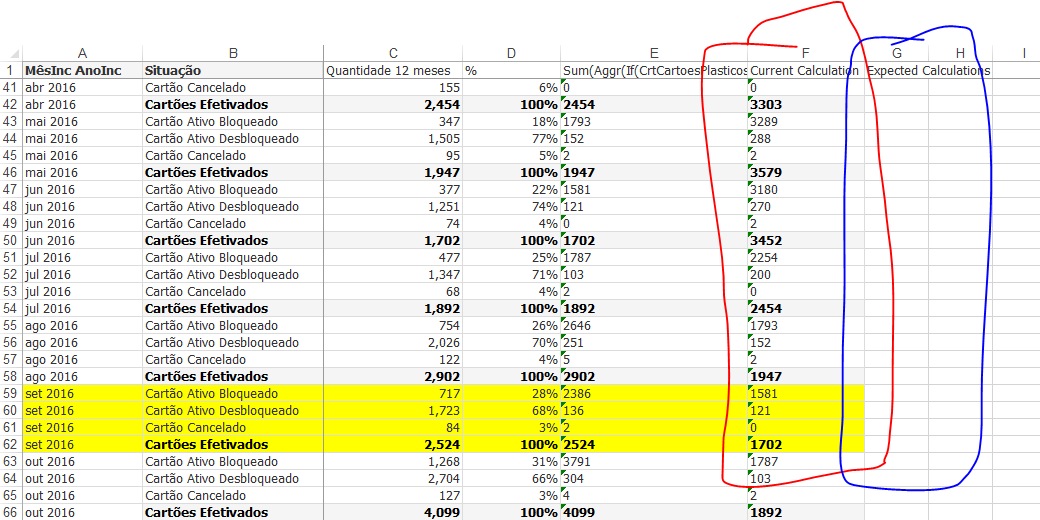
Currently, all I am doing is that for a particular Situação, I am pulling three months back numbers. For instance, if you look at Cartão Ativo Bloqueado for Set 2016 = 1581 (Column F, Row 59) which is the same number we see for jun 2016 (Column E, Row 47).
Now all I want you to do is to fill column G with what you think should be the correct number
- Mark as New
- Bookmark
- Subscribe
- Mute
- Subscribe to RSS Feed
- Permalink
- Report Inappropriate Content
Sunny, I analysed the database and found that the informations are dinamic for the data. That's why the values don't match. We will stop this dashboard for a time.
Thank you very much for your time and help.
- Mark as New
- Bookmark
- Subscribe
- Mute
- Subscribe to RSS Feed
- Permalink
- Report Inappropriate Content
Okay... I would request you to close this thread and may be reopen a new discussion when you get back to it.
Qlik Community Tip: Marking Replies as Correct or Helpful
Thanks,
Sunny
- Mark as New
- Bookmark
- Subscribe
- Mute
- Subscribe to RSS Feed
- Permalink
- Report Inappropriate Content
I would have deleted the qvw.... you removed some of the important information from this post. Really feel bad that I spent so much time helping you out... 
- Mark as New
- Bookmark
- Subscribe
- Mute
- Subscribe to RSS Feed
- Permalink
- Report Inappropriate Content
I tried to delete just the qvw but it excluded everything. Why this happened?
- Mark as New
- Bookmark
- Subscribe
- Mute
- Subscribe to RSS Feed
- Permalink
- Report Inappropriate Content
Because you have to edit the post and then remove the attachment rather than just deleting everything. It is just disappointing to see that after so much help that I was trying to offer, all have been deleted. Anyways please close this thread at least by marking Assumed Answer
- Mark as New
- Bookmark
- Subscribe
- Mute
- Subscribe to RSS Feed
- Permalink
- Report Inappropriate Content
I'm really sorry for that. I have the conversation in my email.. I'll post it .
Sorry for my error again.
- Mark as New
- Bookmark
- Subscribe
- Mute
- Subscribe to RSS Feed
- Permalink
- Report Inappropriate Content
Sunny , These are your answers. Please just copy and paste again to you receive the credit for that.
Is this what you wanted?
https://community.qlik.com/servlet/JiveServlet/downloadImage/2-1360089-179272/Capture.PNG
Expression
If(CrtCartoesPlasticos_SITUACAO = 'B', Count(TOTAL <[MêsInc AnoInc]> CrtCartoesPlasticos_SITUACAO) - Count(TOTAL <[MêsInc AnoInc]>If([MêsInc AnoInc]=[MêsSit AnoSit],CrtCartoesPlasticos_SITUACAO)),
If(Match(CrtCartoesPlasticos_SITUACAO, 'A', 'C'), Count(If([MêsInc AnoInc] = [MêsSit AnoSit],CrtCartoesPlasticos_SITUACAO)), Count(CrtCartoesPlasticos_SITUACAO)))
-----------------
Check this
Sum(Aggr(
If(CrtCartoesPlasticos_SITUACAO = 'B',
Count(TOTAL <[MêsInc AnoInc]> CrtCartoesPlasticos_SITUACAO) - Count(TOTAL <[MêsInc AnoInc]>If([MêsInc AnoInc]=[MêsSit AnoSit],CrtCartoesPlasticos_SITUACAO)),
Count(If([MêsInc AnoInc] = [MêsSit AnoSit],CrtCartoesPlasticos_SITUACAO))), [MêsInc AnoInc], CrtCartoesPlasticos_SITUACAO))
https://community.qlik.com/servlet/JiveServlet/downloadImage/2-1360301-179284/Capture.PNG
---------------------
This looks good now?
https://community.qlik.com/servlet/JiveServlet/downloadImage/2-1362279-179696/Capture.PNG
Expression used:
Sum(Aggr(
If(CrtCartoesPlasticos_SITUACAO = 'B',
Count(TOTAL <[MêsInc AnoInc]> CrtCartoesPlasticos_SITUACAO) - Count(TOTAL <[MêsInc AnoInc]> {<CrtCartoesPlasticos_SITUACAO = {'A', 'C'}>}If([MêsInc AnoInc]=[MêsSit AnoSit],CrtCartoesPlasticos_SITUACAO)),
Count(If([MêsInc AnoInc] = [MêsSit AnoSit],CrtCartoesPlasticos_SITUACAO))), [MêsInc AnoInc], CrtCartoesPlasticos_SITUACAO))
- « Previous Replies
-
- 1
- 2
- Next Replies »