Unlock a world of possibilities! Login now and discover the exclusive benefits awaiting you.
- Qlik Community
- :
- All Forums
- :
- QlikView App Dev
- :
- Combine two date fields and count on another field...
- Subscribe to RSS Feed
- Mark Topic as New
- Mark Topic as Read
- Float this Topic for Current User
- Bookmark
- Subscribe
- Mute
- Printer Friendly Page
- Mark as New
- Bookmark
- Subscribe
- Mute
- Subscribe to RSS Feed
- Permalink
- Report Inappropriate Content
Combine two date fields and count on another field as straight/pivot table
Hi,
I have the following data table where I'm trying to create a straight/pivot table where the two date fields are combined and the person's are counted.
| Person | Start Date | End Date |
|---|---|---|
| A | 01/08/2017 | Null |
| B | 03/09/2017 | 20/10/2017 |
| C | 16/09/2017 | 25/10/2017 |
| D | 25/09/2017 | 05/11/2017 |
| E | 01/10/2017 | Null |
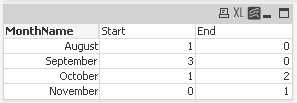
Desired outcome
| Year | ||
| Month | Start | End |
|---|---|---|
| August | 1 | 0 |
| September | 3 | 0 |
| October | 1 | 2 |
| November | 0 | 1 |
Please can you help?
Thanks,
Darren
- Mark as New
- Bookmark
- Subscribe
- Mute
- Subscribe to RSS Feed
- Permalink
- Report Inappropriate Content
Hi Darren,
How about following
NoConcatenate
PersonTmp:
LOAD Person,
Date("Start Date", 'MM/DD/YYYY') as [Start Date],
Date("End Date", 'MM/DD/YYYY') as [End Date]
Inline [Person; "Start Date"; "End Date"
"A"; "08/01/2017"; ""
"B"; "09/03/2017"; "10/20/2017"
"C"; "09/16/2017"; "10/25/2017"
"D"; "09/25/2017"; "11/05/2017"
"E"; "10/01/2017"; ""] (delimiter is ';') ;
NoConcatenate
Person:
LOAD Person
,Date([Start Date], 'DD/MM/YYYY') as [Start Date]
,Date([End Date], 'DD/MM/YYYY') as [End Date]
,Left(MonthName(Date([Start Date], 'DD/MM/YYYY')),3) as StartMonthName
,Left(MonthName(Date([End Date], 'DD/MM/YYYY')),3) as EndMonthName
Resident PersonTmp;
NoConcatenate
StartMonthCount:
LOAD StartMonthName as CountMonth
,Count(Person) as StartPersonCount
Resident Person
Group by StartMonthName;
NoConcatenate
EndMonthCount:
LOAD EndMonthName as CountMonth
,Count(Person) as EndPersonCount
Resident Person
Where Len(EndMonthName) > 0
Group by EndMonthName;
DROP Table PersonTmp;
- Mark as New
- Bookmark
- Subscribe
- Mute
- Subscribe to RSS Feed
- Permalink
- Report Inappropriate Content
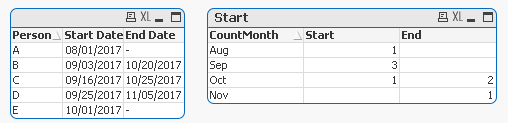
Try this way bt concatenate the tables
Source:
LOAD Person,
[Start Date],
[End Date]
FROM
[https://community.qlik.com/message/1366101?et=watches.email.thread#1366101]
(html, codepage is 1252, embedded labels, table is @1);
New:
LOAD Person, [Start Date], Month(MonthName([Start Date])) as MonthName,
MonthName([Start Date]) as StartMonth
Resident Source;
Concatenate(New)
LOAD Person, [End Date], Month(MonthName([End Date])) as MonthName,
MonthName([End Date]) as EndMonth
Resident Source;
DROP Table Source;
- Mark as New
- Bookmark
- Subscribe
- Mute
- Subscribe to RSS Feed
- Permalink
- Report Inappropriate Content
Hi Darren,
Try:
Data:
LOAD * INLINE [
Person, Start Date, End Date
A, 01/08/2017,
B, 03/09/2017, 20/10/2017
C, 16/09/2017, 25/10/2017
D, 25/09/2017, 05/11/2017
E, 01/10/2017,
];
Person2StartDate:
Mapping LOAD Person, [Start Date] Resident Data;
Person2EndDate:
Mapping LOAD Person, [End Date] Resident Data;
DateBridge:
Load Person,
Applymap('Person2StartDate',Person,Null()) as CanonicalDate,
Month(Applymap('Person2StartDate',Person,Null())) as CanonicalMonth,
'Start' as DateType
Resident Data;
Load Person, Applymap('Person2EndDate',Person,Null()) as CanonicalDate,
Month(Applymap('Person2EndDate',Person,Null())) as CanonicalMonth,
'End' as DateType
Resident Data;
Then this pivot table (check Suppress When Value Is Null for Canonical Month dimension)
| CanonicalMonth | DateType | Start | End |
|---|---|---|---|
| Aug | 1 | ||
| Sep | 3 | ||
| Oct | 1 | 2 | |
| Nov | 1 |
Cheers
Andrew
- Mark as New
- Bookmark
- Subscribe
- Mute
- Subscribe to RSS Feed
- Permalink
- Report Inappropriate Content
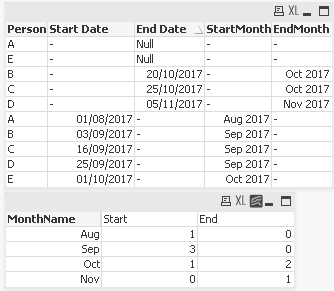
Another way is using full month names like
Source:
LOAD Person,
[Start Date],
[End Date]
FROM
[https://community.qlik.com/message/1366101?et=watches.email.thread#1366101]
(html, codepage is 1252, embedded labels, table is @1);
New:
LOAD Person, [Start Date], Date(MonthName([Start Date]),'MMMMM') as MonthName,
MonthName([Start Date]) as StartMonth
Resident Source;
Concatenate(New)
LOAD Person, [End Date], Date(MonthName([End Date]),'MMMMM') as MonthName,
MonthName([End Date]) as EndMonth
Resident Source;
DROP Table Source;
On Pivot Chart
Dim:- MonthName
Expre:- =Count(StartMonth) // For Start
Expre:- =Count(EndMonth) // For End