Unlock a world of possibilities! Login now and discover the exclusive benefits awaiting you.
- Qlik Community
- :
- All Forums
- :
- Qlik NPrinting
- :
- Nprinting output as data in horizontal pivot table...
- Subscribe to RSS Feed
- Mark Topic as New
- Mark Topic as Read
- Float this Topic for Current User
- Bookmark
- Subscribe
- Mute
- Printer Friendly Page
- Mark as New
- Bookmark
- Subscribe
- Mute
- Subscribe to RSS Feed
- Permalink
- Report Inappropriate Content
Nprinting output as data in horizontal pivot table.
Hi All,
Can anyone guide me with the following issue we are facing with Nprinting.
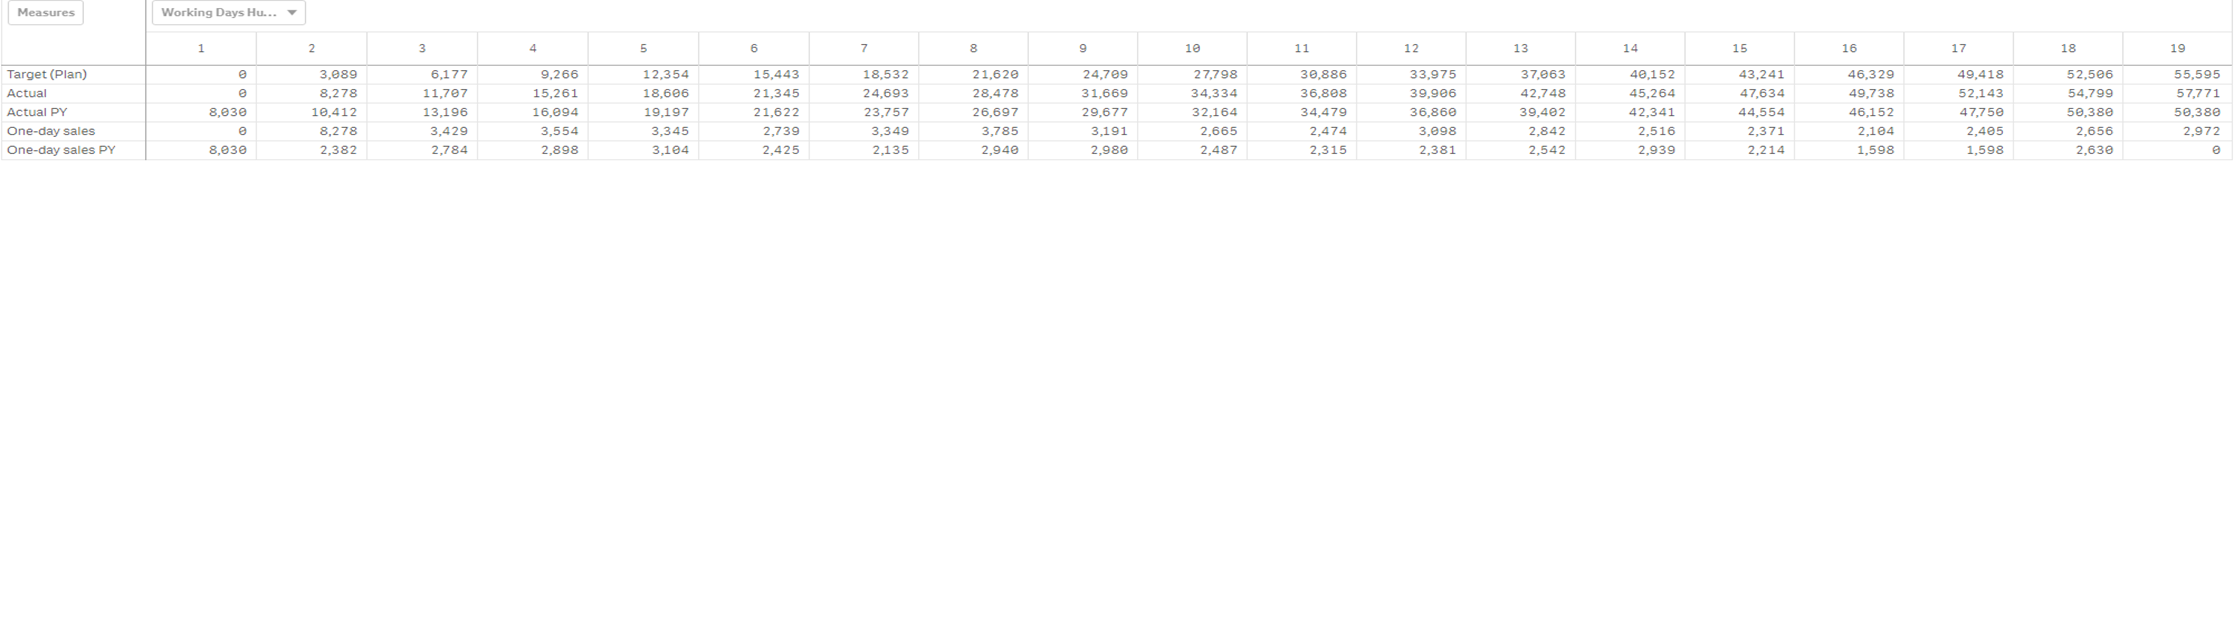
We use a Pivot table with range sum(cumulative value), now we want to use that chart in NPrinting.
The chart comes fine as image but we want it in excel data instead of image.
NPrinting allows to convert the Pivor table into data using vertical table instead of horizontal pivot table.
Kindly let us know the workaround to bring the data as horizontal pivot table using Nprinting.
Version of Nprinting: 17.2.
Qlik Sense: Sept 2017
Thanking you in advance.
Regards,
Vishal.
- Mark as New
- Bookmark
- Subscribe
- Mute
- Subscribe to RSS Feed
- Permalink
- Report Inappropriate Content
Hi Vishal,
NPrinting does not support Qlik Sense pivot charts as tables in excel report template.
I use a straight table with some set analysis as a workaround when using pivot like tables.
sum({$<Answer = {'Answer1'}>} ValueToSumField)
Thanks Darrell
If this was helpful please mark as such.
- Mark as New
- Bookmark
- Subscribe
- Mute
- Subscribe to RSS Feed
- Permalink
- Report Inappropriate Content
Hi,
In Qlik NPrinting you can create Excel pivot tables in two ways:
- Creating pivot table using Excel table columns ‒ Qlik NPrinting I suggest to use this second way
Based on the picture you posted I suppose the result you want to obtain is supported by Qlik NPrinting. You create an Excel vertical table in an hidden template worksheet and then use that data to create a pivot table in a visible worksheet as the on in your image. What I understood is that your pivot has a field in the columns and one in the rows.
If my suggestion did not resolve please post more screenshots with details.
Best Regards,
Ruggero
---------------------------------------------
When applicable please mark the appropriate replies as CORRECT. This will help community members and Qlik Employees know which discussions have already been addressed and have a possible known solution. Please mark threads as HELPFUL if the provided solution is helpful to the problem, but does not necessarily solve the indicated problem. You can mark multiple threads as HELPFUL if you feel additional info is useful to others.
Best Regards,
Ruggero
---------------------------------------------
When applicable please mark the appropriate replies as CORRECT. This will help community members and Qlik Employees know which discussions have already been addressed and have a possible known solution. Please mark threads with a LIKE if the provided solution is helpful to the problem, but does not necessarily solve the indicated problem. You can mark multiple threads with LIKEs if you feel additional info is useful to others.