Unlock a world of possibilities! Login now and discover the exclusive benefits awaiting you.
- Qlik Community
- :
- Forums
- :
- Analytics
- :
- New to Qlik Analytics
- :
- Sum of the same companies in different years
- Subscribe to RSS Feed
- Mark Topic as New
- Mark Topic as Read
- Float this Topic for Current User
- Bookmark
- Subscribe
- Mute
- Printer Friendly Page
- Mark as New
- Bookmark
- Subscribe
- Mute
- Subscribe to RSS Feed
- Permalink
- Report Inappropriate Content
Sum of the same companies in different years
Hello,
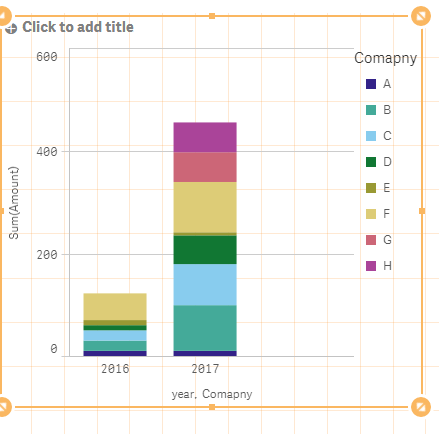
I have different companies in different years. I want to calculate the sum of the same companies in the bar chart. The sum also should be for the max date.Bar should look like this
- « Previous Replies
-
- 1
- 2
- Next Replies »
Accepted Solutions
- Mark as New
- Bookmark
- Subscribe
- Mute
- Subscribe to RSS Feed
- Permalink
- Report Inappropriate Content
It can be done using set analysis
Sum({<Company = p({<Year = {"$(=Max(Year) - 1)"}>})>}Measure)
- Mark as New
- Bookmark
- Subscribe
- Mute
- Subscribe to RSS Feed
- Permalink
- Report Inappropriate Content
Hi,
I understand that you need two dimensions : Company and Year.
and one Expression : sum(Amount)
- Mark as New
- Bookmark
- Subscribe
- Mute
- Subscribe to RSS Feed
- Permalink
- Report Inappropriate Content
Hi,
try to attach some screen shots of the result you have, what is actually wrong, the desired output, the expression and dimension used.
- Mark as New
- Bookmark
- Subscribe
- Mute
- Subscribe to RSS Feed
- Permalink
- Report Inappropriate Content
For example,
In 2016 ---- Companies : A,B,C,D,E,F
In 2017 ---- Companies: A,B,C,D,E,F,G,H
I want to have the sum of the companies (A,B,C,D,E,F) in 2016 and in 2017.
- Mark as New
- Bookmark
- Subscribe
- Mute
- Subscribe to RSS Feed
- Permalink
- Report Inappropriate Content
Hi,
Can you please share some sample data or detailed questions.
Here it seems that you want 2 dimensions one is your companies and other is years and sum(amount) as measures. So for this simply you can take bar chart and implement that.
Thanks,
Pooja
- Mark as New
- Bookmark
- Subscribe
- Mute
- Subscribe to RSS Feed
- Permalink
- Report Inappropriate Content
take Dimension as a Year and measure sum({<Companies ={'A','B','C','D','E','F'}>}FieldName)
for all Companies sum({<Companies ={"*"}>}FieldName)
- Mark as New
- Bookmark
- Subscribe
- Mute
- Subscribe to RSS Feed
- Permalink
- Report Inappropriate Content
Do you want like following... If yes ..simple take take bar chart and stacked companies from presentation.
Let me know it this works for you.

Thanks,
Pooja
- Mark as New
- Bookmark
- Subscribe
- Mute
- Subscribe to RSS Feed
- Permalink
- Report Inappropriate Content
It can be done using set analysis
Sum({<Company = p({<Year = {"$(=Max(Year) - 1)"}>})>}Measure)
- Mark as New
- Bookmark
- Subscribe
- Mute
- Subscribe to RSS Feed
- Permalink
- Report Inappropriate Content
Thank you all for your responses,
In 2016 there were 5 companies , In 2017 two companies were added. But I want to show the sum of the 5 companies that were in the last year too. This formula seems correct, but the sum is calculated for the 7 companies in 2017. ( I hope you understand what I mean)
- Mark as New
- Bookmark
- Subscribe
- Mute
- Subscribe to RSS Feed
- Permalink
- Report Inappropriate Content
I do and I would expect it to show the sum of only those 5 companies which were present in 2016. Would you be able to share an example where you can demonstrate it not working? This way we can see what is going on
- « Previous Replies
-
- 1
- 2
- Next Replies »