Unlock a world of possibilities! Login now and discover the exclusive benefits awaiting you.
- Qlik Community
- :
- All Forums
- :
- QlikView
- :
- Re: Different color for each of the Expression Hea...
- Subscribe to RSS Feed
- Mark Topic as New
- Mark Topic as Read
- Float this Topic for Current User
- Bookmark
- Subscribe
- Mute
- Printer Friendly Page
- Mark as New
- Bookmark
- Subscribe
- Mute
- Subscribe to RSS Feed
- Permalink
- Report Inappropriate Content
Different color for each of the Expression Header
How can we give Different color for each of the Expression Header and Dimension Header
- Mark as New
- Bookmark
- Subscribe
- Mute
- Subscribe to RSS Feed
- Permalink
- Report Inappropriate Content
Can't.
- Mark as New
- Bookmark
- Subscribe
- Mute
- Subscribe to RSS Feed
- Permalink
- Report Inappropriate Content
Hi is possible!
Go to View> Design Grid and check this option.
Then go in the cell you want to change color and click right selecting Custom Format Cell.
There you can change the color of the header and also the dimensions.

- Mark as New
- Bookmark
- Subscribe
- Mute
- Subscribe to RSS Feed
- Permalink
- Report Inappropriate Content
For this
you have firstly
you go to
setting-->User Prefrence-->Design Tab
and at last you see the Always Show Design Menu tem (Check it)
then go to your chart
keep curson in the middle of chart not on caption and right click on it
go to custom format cell there on white screen where you want to change color go there ang click on backgroung color then ok (Only for header dimension and expression)
for different color on expression or dimension for value
click on '+' icon with that dimension or expression maximize it then you ll see background color go there and addcolor whats you want for all field values in expression and dimension
- Mark as New
- Bookmark
- Subscribe
- Mute
- Subscribe to RSS Feed
- Permalink
- Report Inappropriate Content
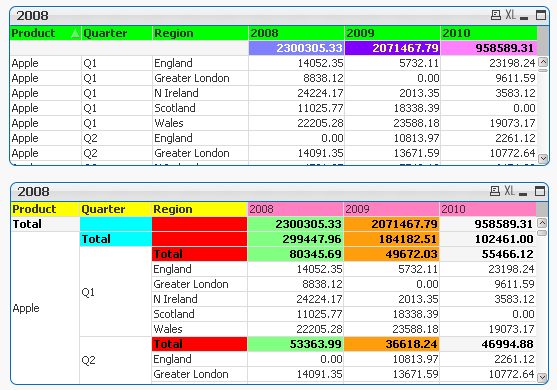
The options are very limited. In a straight chart you can only give the totals individual formatting. All dimension and expression header always get the same formatting. In a pivot table all the dimension headers get the same formatting and all the expression headers get the same formatting. The total of dimensions and expressions can be giving individual formatting, but all total levels within an expression or dimension get the same formatting. See below example:
talk is cheap, supply exceeds demand