Unlock a world of possibilities! Login now and discover the exclusive benefits awaiting you.
- Qlik Community
- :
- All Forums
- :
- QlikView
- :
- bar chart color based on threshold
- Subscribe to RSS Feed
- Mark Topic as New
- Mark Topic as Read
- Float this Topic for Current User
- Bookmark
- Subscribe
- Mute
- Printer Friendly Page
- Mark as New
- Bookmark
- Subscribe
- Mute
- Subscribe to RSS Feed
- Permalink
- Report Inappropriate Content
bar chart color based on threshold
hi all,
i have my bar chart having threshold which shows avg(value).i had given the condition in the expression for the background color of bar chart like color blue if less than 400 else red.its working fine. 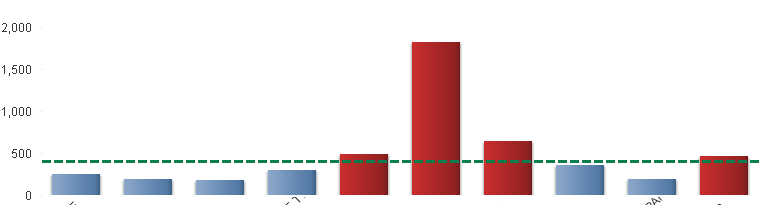
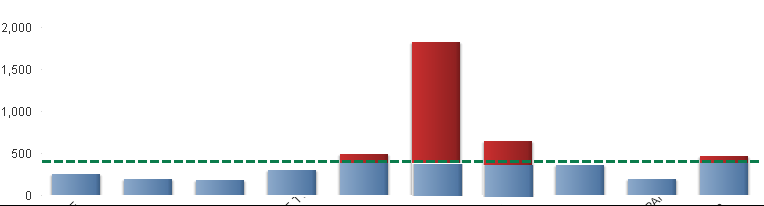
But my question is can i show blue color on the bars(red) which are below the green line? that is like this
- Tags:
- new_to_qlikview
Accepted Solutions
- Mark as New
- Bookmark
- Subscribe
- Mute
- Subscribe to RSS Feed
- Permalink
- Report Inappropriate Content
See my solution in this discussion: Different color for a bar based on Reference Value
talk is cheap, supply exceeds demand
- Mark as New
- Bookmark
- Subscribe
- Mute
- Subscribe to RSS Feed
- Permalink
- Report Inappropriate Content
See my solution in this discussion: Different color for a bar based on Reference Value
talk is cheap, supply exceeds demand
- Mark as New
- Bookmark
- Subscribe
- Mute
- Subscribe to RSS Feed
- Permalink
- Report Inappropriate Content
Hi.
For almost static charts you can create two objects: background 'red' chart and transparent overlay 'blue' chart.
Another way, create additional Calculated dimension: ValueList(1,2)
And expression that splits the values:
=pick(rowno(), RangeMin(Value, 400), RangeMax (Value, 400)-400)
- Mark as New
- Bookmark
- Subscribe
- Mute
- Subscribe to RSS Feed
- Permalink
- Report Inappropriate Content
Thank you..