Unlock a world of possibilities! Login now and discover the exclusive benefits awaiting you.
- Qlik Community
- :
- All Forums
- :
- QlikView
- :
- Re: compare data with month from previous year
- Subscribe to RSS Feed
- Mark Topic as New
- Mark Topic as Read
- Float this Topic for Current User
- Bookmark
- Subscribe
- Mute
- Printer Friendly Page
- Mark as New
- Bookmark
- Subscribe
- Mute
- Subscribe to RSS Feed
- Permalink
- Report Inappropriate Content
compare data with month from previous year
Hello, I'm relatively new at Qlikview and wanted to compare some data from a selected year with its previous year.
In Qlikview I have a table in which i show the count of all the contacts there have been with the customer per mount [=count(contactsID)] with the dimension [contacts.month]
I want to show an other expression with the contacts with customers in the same month a year before.
So if my table shows all the contacts from jan-2014 until dec-2014 I want a bar next to every month with the months jan-2013 until dec-2013
for example jan-2013/jan-2014; feb-2013/feb-2014; etc
If anybody could help i would be very grateful! Thanks to all of you in advance!
- « Previous Replies
-
- 1
- 2
- Next Replies »
Accepted Solutions
- Mark as New
- Bookmark
- Subscribe
- Mute
- Subscribe to RSS Feed
- Permalink
- Report Inappropriate Content
Add expression as:
count({<contact.year={$(=contact.year-1)}>}ContactID
regards
Darek
- Mark as New
- Bookmark
- Subscribe
- Mute
- Subscribe to RSS Feed
- Permalink
- Report Inappropriate Content
In this chart you have also year as dimension, or maybe your contacts.month field has year-month information?
- Mark as New
- Bookmark
- Subscribe
- Mute
- Subscribe to RSS Feed
- Permalink
- Report Inappropriate Content
sorry for not being clear about that!
In the database i have a date field and in Qlikview i load that as
Load
date as contact.date
year(date) as contact.year,
month(date) as contact.month,
day(date) as contact.day,
so contact.month is the month of the date in the database.
- Mark as New
- Bookmark
- Subscribe
- Mute
- Subscribe to RSS Feed
- Permalink
- Report Inappropriate Content
TOm,
but as you told, you have selected year (i expect, one selected year).
So, your expression:
=count(contactsID)
gives you result for selected year and for months from your chart dimension.
Now if you would like to have also expression for year-1 you may use set analysis.
Find attached example.
regards
Darek
- Mark as New
- Bookmark
- Subscribe
- Mute
- Subscribe to RSS Feed
- Permalink
- Report Inappropriate Content
If you are using time as dimension, two ways I can see:
- Script: Create a monthly aggregated field for last year using previous/peek function on ordered data
- Front end: Using a complex logic with synthetic dimension (ValueLoop()/ValueLis()) and expression using
Pick(Match(
The suggested one is script-way.
- Mark as New
- Bookmark
- Subscribe
- Mute
- Subscribe to RSS Feed
- Permalink
- Report Inappropriate Content
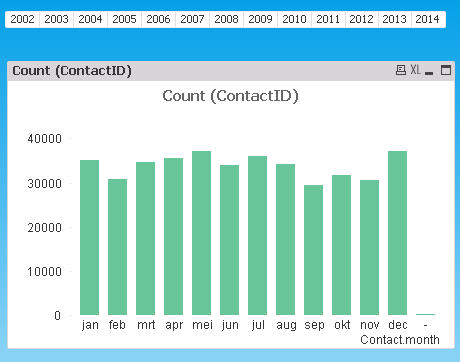
In qlikview i made a selection option for years. If you select 2014 i want the table to show 2014 and 2013. The table has the dimension {Contact.Month} and the expresion {count(ContactID)} as you can see below
- Mark as New
- Bookmark
- Subscribe
- Mute
- Subscribe to RSS Feed
- Permalink
- Report Inappropriate Content
ps. i have only a personal version. so i can't open your file. Sorry for that :$
- Mark as New
- Bookmark
- Subscribe
- Mute
- Subscribe to RSS Feed
- Permalink
- Report Inappropriate Content
Add expression as:
count({<contact.year={$(=contact.year-1)}>}ContactID
regards
Darek
- Mark as New
- Bookmark
- Subscribe
- Mute
- Subscribe to RSS Feed
- Permalink
- Report Inappropriate Content
Thank you very much!!!
- Mark as New
- Bookmark
- Subscribe
- Mute
- Subscribe to RSS Feed
- Permalink
- Report Inappropriate Content
Hi,
you can use two expressions in your diagramm:
- count(contactsID)
- count({$ <contact.year={$(=only(contact.year) - 1)}>} contactsID)
The second expression uses set-analysis (the part in the {}-brackets).
- « Previous Replies
-
- 1
- 2
- Next Replies »