Unlock a world of possibilities! Login now and discover the exclusive benefits awaiting you.
- Qlik Community
- :
- Forums
- :
- Analytics & AI
- :
- Products & Topics
- :
- Visualization and Usability
- :
- In Qlik Sense how would you create measure to show...
- Subscribe to RSS Feed
- Mark Topic as New
- Mark Topic as Read
- Float this Topic for Current User
- Bookmark
- Subscribe
- Mute
- Printer Friendly Page
- Mark as New
- Bookmark
- Subscribe
- Mute
- Subscribe to RSS Feed
- Permalink
- Report Inappropriate Content
In Qlik Sense how would you create measure to show ThisYear sales rev and LastYrsales rev
I would like to show in a table the Regional sales for ThisYr(2014) and LastYr(2013). Plus a Variance at the end
| Region Name | 2013 SALES | 2014 SALES |
|---|---|---|
| Berkshire | $100 | $200 |
| Bucks | $50 | $150 |
| Bedfordshire | $400 | $300 |
The data is stored by transaction date in an Xls sheet, which I have been able to convert to via the Load script to Month, Quarter and Year. In Qlik View it appears you are able to use variables to achieve this. How would this problem be approached in Qlik sense.
Thanks
- « Previous Replies
-
- 1
- 2
- Next Replies »
Accepted Solutions
- Mark as New
- Bookmark
- Subscribe
- Mute
- Subscribe to RSS Feed
- Permalink
- Report Inappropriate Content
You can do this using variables in Qlik Sense. Note variables exist in Qlik Sense you just can interact with them in the UI (yet). So you can create two variables in the script (vCurrentYear and vLastYear) and then use those to drive you set analysis. Please see example attached.
-Josh
- Mark as New
- Bookmark
- Subscribe
- Mute
- Subscribe to RSS Feed
- Permalink
- Report Inappropriate Content
Hi Anuj,
Another way this can be done without variables and without using script in the data load editor, is to use the appropriate expression syntax define within "Measures" under the library. This way these measures can be reused within in the app, without having to define them in each chart object.
("Measures" can also use the variables that are defined in the script within their expressions if needed, which is very useful if you want to make a change to a variable in one location, instead of updating the measure (depending on the calculation). Both very useful and flexible examples of how this can be achieved. Variables make the expression easier to read.)
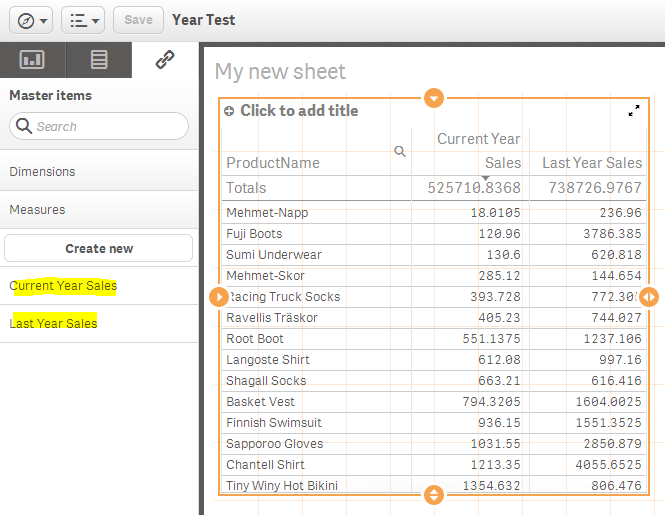
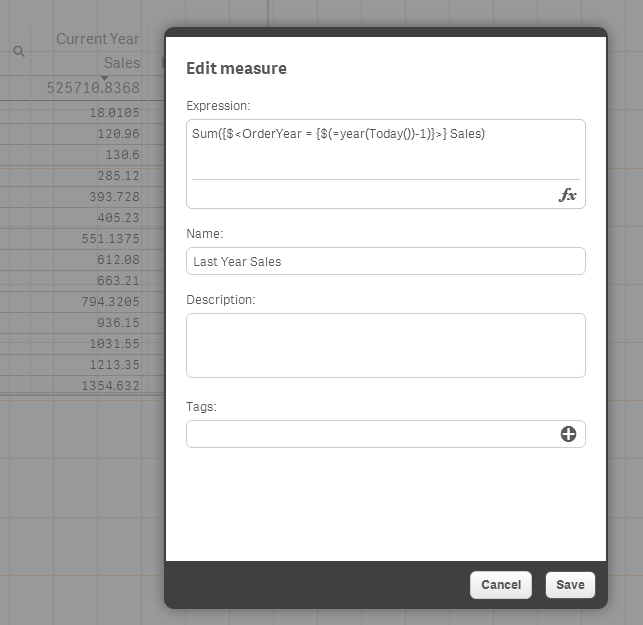
Define two new measures:
- Current Year Sales as Sum({$<OrderYear = {$(=year(Today()))}>} Sales)
- Last Year Sales as Sum({$<OrderYear = {$(=year(Today())-1)}>} Sales)
The syntax used is known as Set Analysis and is a very powerful for calculations.
Here is the example - attached without variables.


HTH
Mike
Mike Tarallo
Qlik
- Mark as New
- Bookmark
- Subscribe
- Mute
- Subscribe to RSS Feed
- Permalink
- Report Inappropriate Content
Hi All,
I'm trying to make it a bit more complex: I do not want the comparison between this year and last year to be static but relative to the Max(Date).
I'm trying to use something like this:
Sum({$<OrderDate = {$(=Max(OrderDate))}>} Sales)
I have also tried to define a variable :
let vMaxDate = 'date(max(OrderDate))';
That work if I use it in a text object but not if I place it in the variable.
Any suggestions?
Regards,
- Mark as New
- Bookmark
- Subscribe
- Mute
- Subscribe to RSS Feed
- Permalink
- Report Inappropriate Content
Hi Filippo,
Your expression needs to be
Sum({$<OrderDate = {"$(=Max(OrderDate))"}>} Sales)
Double quotes are missing in your expression.
Also, please specify in detail of what you wanted to achieve.
From the above expression, it only calculates the sales for the latest date from the selections.
Are you looking for Sales for the latest date and the Sales for the same date in last year.
Please check out for "Set Analysis" in help
Thanks,
Sri
- Mark as New
- Bookmark
- Subscribe
- Mute
- Subscribe to RSS Feed
- Permalink
- Report Inappropriate Content
Set Analysis help from QlikSense
- Mark as New
- Bookmark
- Subscribe
- Mute
- Subscribe to RSS Feed
- Permalink
- Report Inappropriate Content
Thanks,
Yes, sorry I was just trying to apply the same problem to my case that is not on sales but on balance.
The goal is to have the balance for a particular day. With your expression it work.
- Mark as New
- Bookmark
- Subscribe
- Mute
- Subscribe to RSS Feed
- Permalink
- Report Inappropriate Content
Hi Sri,
Currently I'm using the following in the script:
Let vBudget = 'Sum(BDG)';
I also tried with Set vBudget = ......
both in text and table object I get null value as result using $(vBudget).
Like Qlikview I'd use the same variable name in all expression objects.
How can I achieve it with Sense ?
Many thanks in advance.
Best Regards
Andrea
- Mark as New
- Bookmark
- Subscribe
- Mute
- Subscribe to RSS Feed
- Permalink
- Report Inappropriate Content
Hey Michael,
Seems like Variables and Measures are very similar. The main benefit in my eyes is "reuse"
(In fact had you all considered just re-branding Variables as "Measures", so that the "Measures" accordion just became a newer Ctrl+Alt+V? I struggle when features seem duplicative... I need guidance for my team. Seems like this may've been done to imitate a Tableau terminology)
In what scenario would you pick variables , vs what scenario a measure? (And I guess, a "Dimension", for that matter? Please note I'm not coming from a Tableau angle. I'm coming from an "Aren't they all just expressions" angle.)
A few aspects:
- You mentioned: Measures can use Variables (but Variables can't use measures).
- Josh mentioned: Variables can be defined in a load script (measures cannot)
- I just encountered (please confirm?): An extension I'm using can be configured with an expression (the "fx" button which opens the "Expression editor"). I can't use a Measure in there? So Expression editors can't use Measures (but Expression editors can use Variables)
- You might say, the best practice should be to design an Extension which accepts a measure instead of only an expression, but I don't have that choice
- I like how Measures (and Dimensions) can be viewed in a panel on the left, and drag-dropped onto the corresponding areas while configuring a visualization on the right. This reinforces a Tableau-esque mental-model and an ease-of-use.
- In contrast, Variables don't appear anywhere in the UI;
- variables do appear in auto-complete while you type using expression editor (as it did in Qlikview),
- (Measures do not appear in auto-complete do they? Else I could use them in expressions)
- variables also appear in the Variables overview, which is separated from "Master items" and doesn't have drag-and-dropability
- I'm starting to appreciate how important Security re: "resources" is in Qlik Sense. Are measures something that can be secured? Not sure... But they are something that can be published.
- When an app is published,
- it seems I cannot edit variables (or the load script for that matter).
- (Indeed that's only an option when app is an "Unpublished App")
- I can still add measures (but are my measures only affecting "my sheets"? My colleagues can't see my...
- Should I be able to add measures? This says a "Published App" can use master items, but doesn't say I can create them?
- If I should be able to add measures; see my comment above about my measure seeming "private" to me. How can I (publish? is that the right word?) my measures so the whole community/public could use them?
- it seems I cannot edit variables (or the load script for that matter).
- API, they both seem to have a comparable "Create" API call (do they both have all "CRUD"?)
Any other differences, guidance?
- Reading more about the API's, I see there is such thing as a "session variable", (it is "transient"), and that, only transient variables can be created once an app is published.
- I also notice the GenericMeasureProperties seem like a strict subset of GenericVariableProperties...
Also, I realize I brought "Dimensions" into this confusion, but maybe they are best left alone. Indeed, it seems like they kinda did coalesce with the idea of "Grouped Dimensions" for example, which in Qlikview was managed in a roundabout way; and now has its own "first class" panel on the left.
Finally, seems Measures are sometimes called "Master Measures"? Maybe because they are one of many types of "Master Items" [informally/symbolically known (by me?) as "linked items]. Makes sense.
- Mark as New
- Bookmark
- Subscribe
- Mute
- Subscribe to RSS Feed
- Permalink
- Report Inappropriate Content
Hello Mike,
On the same line, if I have Months defined Horizontally in my data and I need to apply a filter on that , is it possible to do ?
Eg, Column 1, Column 2 , Column 3
Jan , Feb , Mar
I want to add a filter one for Month and One of Qtr. since the data is Measure, how can I make it dimension to use it as filter? Can you/someone please help?
- « Previous Replies
-
- 1
- 2
- Next Replies »